
Fig. 2.
- ID
- ZDB-IMAGE-221018-11
- Publication
- Bhandiwad et al., 2022 - A cerebellar-prepontine circuit for tonic immobility triggered by an inescapable threat
- All Figures
- Figures for Bhandiwad et al., 2022
|
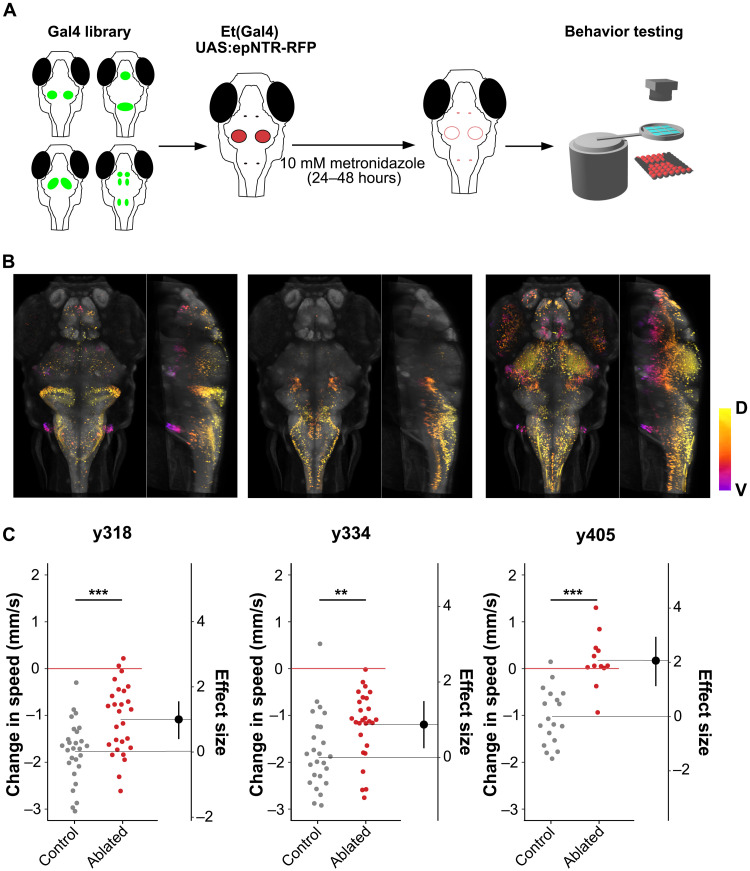
Fig. 2.
(A) Schematic for the circuit-breaking screen using 31 enhancer-trap Gal4 lines. (B) Dorsal and sagittal maximum projection of Gal4 patterns in three lines, y318-Gal4 (left), y334-Gal4 (middle), and y405-Gal4 (right), which showed disruption of arrest following stimulation. Projections are depth-coded, D, dorsal; V, ventral. Gray counterlabel: HuC:Cerulean. (C) Change in locomotion after intense vibration for lines shown in (B) for ablated larvae (red) and intact sibling controls (gray). y318-Gal4 (n = 23 control/26 ablated), y334-Gal4 (n = 21/24), y405-Gal4 (n = 18/12). Effect sizes are Cohen’s d. **P < 0.01, ***P < 0.001, independent samples t test.