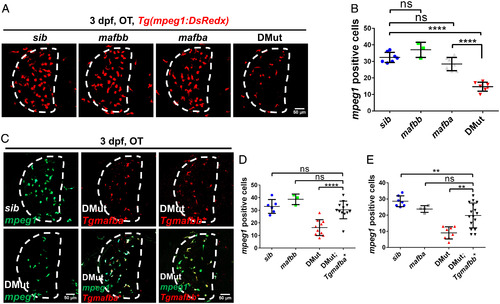
Mafba and Mafbb regulate microglia development cell-autonomously during zebrafish early development. (A) Representative images of microglia in the optic tectum (OT) in 3 dpf siblings, mafba mutants, mafbb mutants, and DMut embryos in Tg(mpeg1:DsRedx) transgenic background. Microglia are labeled in DsRed. Dashed lines indicate the optic tectum region. (B) Quantification of microglia number in the OT in 3 dpf siblings (n = 7), mafba mutants (n = 7), mafbb mutants (n = 3), and DMut (n = 7) (mean ± SD; Student’s t test; nonsignificant [ns] P > 0.05, ****P < 0.0001). (C) Representative images of microglia in the OT in 3 dpf siblings, DMut embryos, DMut;Tg(mfap4:mafba-P2a-DsRedx) transgenic embryos, and DMut;Tg(mfap4:mafbb-P2a-DsRedx) transgenic embryos. Microglia are labeled in green color in Tg(mpeg1:eGFP) transgenic background. The overexpression of mafba and mafbb is indicated by red color in Tg(mfap4:mafba-P2a-DsRedx) and Tg(mfap4:mafbb-P2a-DsRedx) transgenic lines, respectively. Dashed lines indicate OT region. (D and E) Quantification of microglia in the OT in 3 dpf siblings (n = 6 or 7), mafba mutants (n = 4), mafbb mutants (n = 3), DMut (n = 10 or 8), DMut;Tg(mfap4:mafba-P2a-DsRedx) transgenic embryos (n = 12), and DMut;Tg(mfap4:mafbb-P2a-DsRedx) transgenic embryos (n = 16) (mean ± SD; Student’s t test; nonsignificant [ns] P > 0.05, **P < 0.01, ****P < 0.0001).

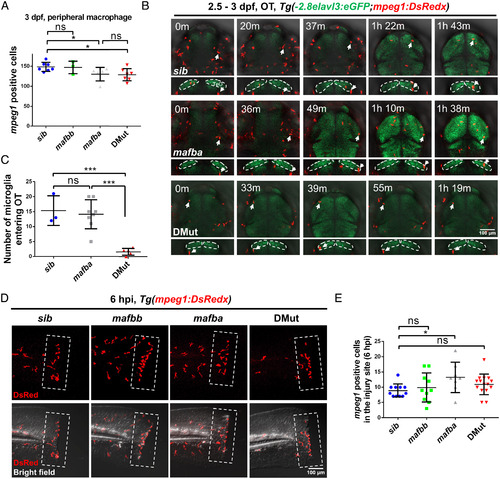
Microglia colonization of the optic tectum is defective in DMut. (A) Quantification of peripheral macrophages in 3 dpf siblings (n = 7), mafba mutants (n = 7), mafbb mutants (n = 3), and DMut (n = 7) in Tg(mpeg1:DsRedx) background (mean ± SD; Student’s t test; nonsignificant [ns] P > 0.05, *P < 0.05). (B) Coronal and transverse views of time-lapse imaging pictures of the midbrain of siblings, mafba mutants, and DMut in Tg(-2.8elavl3:eGFP;mpeg1:DsRedx) transgenic background where microglia are labeled in red and neurons are marked in green. Dashed lines indicate the optic tectum (OT) region. White arrows indicate microglia that have entered the OT. (C) Quantification of microglia number entering the OT in siblings (n = 3), mafba mutants (n = 8), and DMut (n = 5) from 2.5 to 3 dpf (mean ± SD; Student’s t test; nonsignificant [ns] P > 0.05, ***P < 0.001). (D) Representative tail images of peripheral macrophages surrounding the injury sites 6 h post injury (hpi) in 3 dpf siblings, mafba mutants, mafbb mutants, and DMut in Tg(mpeg1:DsRedx) transgenic background. Macrophages are labeled in red color. (E) Quantification of peripheral macrophages surrounding the injury sites 6 h post injury in 3 dpf siblings (n = 11), mafba mutants (n = 8), mafbb mutants (n = 10), and DMut (n = 15) in Tg(mpeg1:DsRedx) transgenic background (mean ± SD; Student’s t test; nonsignificant [ns] P > 0.05, *P < 0.05).

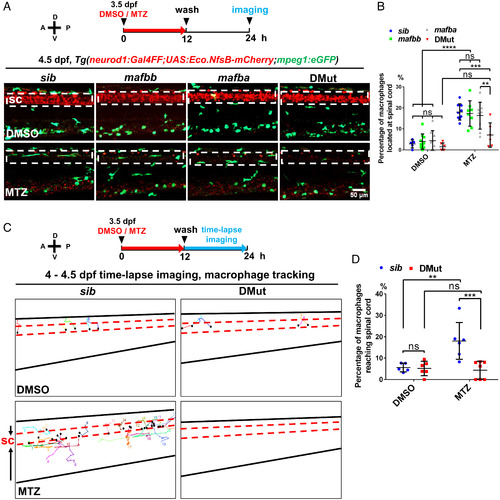
Macrophages in DMut fail to respond to the induction of neuronal apoptosis. (A) Upper Panel: schematic diagram of the workflow of neuronal cell death induction and imaging. A, anterior; P, posterior; D, dorsal; V, ventral. Lower Panel: representative images of the trunk region of 4.5 dpf siblings, mafba mutants, mafbb mutants, and DMut in Tg(neurod1:Gal4FF;UAS:Eco.NfsB-mCherry;mpeg1:eGFP) triple-transgenic background. Top groups are DMSO-treated and Bottom groups are MTZ-treated. Red and green signals represent neurons and macrophages, respectively. White dashed lines indicate the spinal cord region. sc, spinal cord. (B) Percentage of macrophages around the spinal cord region to total macrophages in siblings (n = 5 for DMSO or 9 for MTZ), mafba mutants (n = 9 for DMSO or 9 for MTZ), mafbb mutants (n = 10 for DMSO or 8 for MTZ), and DMut (n = 6 for DMSO or 6 for MTZ) treated with DMSO or MTZ at 4.5 dpf (mean ± SD; two-way ANOVA; nonsignificant [ns] P > 0.05, **P < 0.01, ***P < 0.001, ****P < 0.0001). (C) The mobilization trajectory (from 4 dpf to 4.5 dpf) of macrophages in the trunk of siblings and DMut in Tg(neurod1:Gal4FF;UAS:Eco.NfsB-mCherry;mpeg1:eGFP) triple-transgenic background after DMSO or MTZ treatment. The fish trunk and spinal cord region are indicated by black lines and red dashed lines, respectively. The numbers and black dots indicate start and end points of trajectories, respectively. (D) Percentage of macrophages reaching spinal cord to total macrophages during the imaging period (from 4 dpf to 4.5 dpf) in siblings (n = 5 for DMSO or 6 for MTZ) and DMut embryos (n = 6 for DMSO or 7 for MTZ) (mean ± SD; two-way ANOVA; nonsignificant [ns] P > 0.05, **P < 0.01, ***P < 0.001.

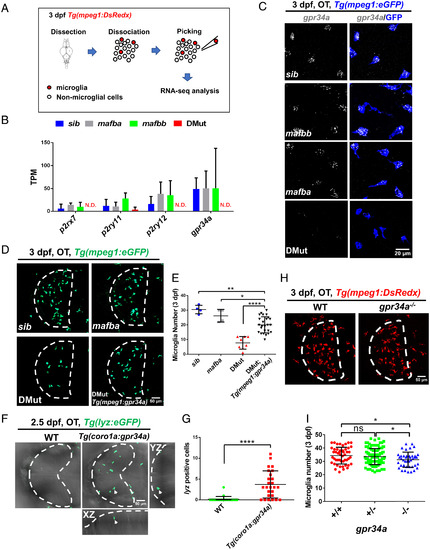
Gpr34a is a downstream target of Mafba and Mafbb and promotes microglia colonization. (A) Workflow of microglia isolation from the brains of 3 dpf siblings, mafba mutants, mafbb mutants and DMut for transcriptomic analysis. (B) Expression level of p2rx7, p2ry11, p2ry12, and gpr34a in siblings, mafba mutants, mafbb mutants, and DMut embryos in RNA-seq data. n = 3 for each group. TPM, transcript per million. N.D., not detected. (C) Representative images of gpr34a RNAscope (gray) and anti-GFP antibody staining (blue) in the optic tectum (OT) of 3 dpf siblings, mafba mutants, mafbb mutants, and DMut in Tg(mpeg1:eGFP) transgenic background. (D) Representative images of microglia in the OT region in 3 dpf siblings, mafba mutants, DMut embryos, and DMut;Tg(mpeg1:gpr34a) transgenic embryos. Microglia are labeled in green color in Tg(mpeg1:eGFP) transgenic background. Dashed lines indicate the OT region. (E) Quantification of microglia number in the OT region in 3 dpf siblings (n = 4), mafba mutants (n = 4), DMut embryos (n = 8), and DMut;Tg(mpeg1:gpr34a) transgenic embryos (n = 25) in Tg(mpeg1:eGFP) transgenic background (mean ± SD; Student’s t test; *P < 0.05, **P < 0.01, ****P < 0.0001). (F) Representative images of neutrophils in the OT region in 2.5 dpf wild-type (WT) and Tg(coro1a:gpr34a) transgenic embryos. Neutrophils are labeled in green color. Dashed lines indicate the OT region. White arrow indicates a neutrophil located in the OT. (G) Quantification of neutrophils in the OT region in 2.5 dpf WT (n = 23) and Tg(coro1a:gpr34a) transgenic embryos (n = 26) (mean ± SD; Student’s t test; ****P < 0.0001). (H) Representative Images of microglia in the OT in 3 dpf WT and gpr34a mutants in Tg(mpeg1: DsRedx) transgenic background. Microglia are labeled in red color. Dashed lines indicate the OT region. (I) Quantification of microglia number in the OT in 3 dpf WT (n = 49), gpr34a heterozygous embryos (n = 124), and gpr34a mutants (n = 41) in Tg(mpeg1: DsRedx) transgenic background (mean ± SD; Student’s t test; nonsignificant [ns] P > 0.05; *P < 0.05).

Macrophages in DMut do not respond to lysoPS. (A) Schematic diagram indicates the PBS/lysoPS injection region. (B) Representative images of recruited macrophages in the optic tectum (OT) region in PBS/lysoPS-injected siblings, mafba mutants, mafbb mutants, and DMut embryos in Tg(Xla.Tubb:bcl-2;mpeg1:DsRedx) double-transgenic background. Macrophages are labeled in red color. Dashed lines indicate the optic tectum region. Arrows represent recruited macrophages in the OT. hpi, hours post injection. (C) Quantification of recruited macrophage number in the OT region in PBS/lysoPS-injected siblings (n = 9 for PBS or 15 for lysoPS), mafba mutants (n = 8 for PBS or 18 for lysoPS), mafbb mutants (n = 5 for PBS or 21 for lysoPS), and DMut embryos (n = 9 for PBS or 18 for lysoPS) in Tg(Xla.Tubb:bcl-2;mpeg1:DsRedx) double-transgenic background (mean ± SD; two-way ANOVA; nonsignificant [ns] P > 0.05, *P < 0.05, **P < 0.01, ****P < 0.0001).

Acknowledgments
This image is the copyrighted work of the attributed author or publisher, and ZFIN has permission only to display this image to its users. Additional permissions should be obtained from the applicable author or publisher of the image. Full text @ Proc. Natl. Acad. Sci. USA