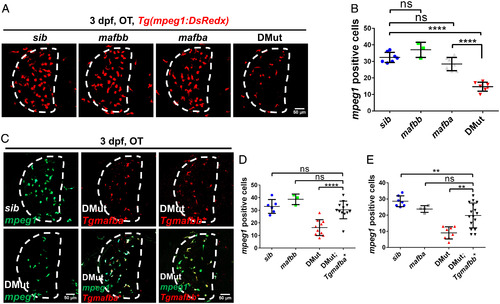
Mafba and Mafbb regulate microglia development cell-autonomously during zebrafish early development. (A) Representative images of microglia in the optic tectum (OT) in 3 dpf siblings, mafba mutants, mafbb mutants, and DMut embryos in Tg(mpeg1:DsRedx) transgenic background. Microglia are labeled in DsRed. Dashed lines indicate the optic tectum region. (B) Quantification of microglia number in the OT in 3 dpf siblings (n = 7), mafba mutants (n = 7), mafbb mutants (n = 3), and DMut (n = 7) (mean ± SD; Student’s t test; nonsignificant [ns] P > 0.05, ****P < 0.0001). (C) Representative images of microglia in the OT in 3 dpf siblings, DMut embryos, DMut;Tg(mfap4:mafba-P2a-DsRedx) transgenic embryos, and DMut;Tg(mfap4:mafbb-P2a-DsRedx) transgenic embryos. Microglia are labeled in green color in Tg(mpeg1:eGFP) transgenic background. The overexpression of mafba and mafbb is indicated by red color in Tg(mfap4:mafba-P2a-DsRedx) and Tg(mfap4:mafbb-P2a-DsRedx) transgenic lines, respectively. Dashed lines indicate OT region. (D and E) Quantification of microglia in the OT in 3 dpf siblings (n = 6 or 7), mafba mutants (n = 4), mafbb mutants (n = 3), DMut (n = 10 or 8), DMut;Tg(mfap4:mafba-P2a-DsRedx) transgenic embryos (n = 12), and DMut;Tg(mfap4:mafbb-P2a-DsRedx) transgenic embryos (n = 16) (mean ± SD; Student’s t test; nonsignificant [ns] P > 0.05, **P < 0.01, ****P < 0.0001).
|
