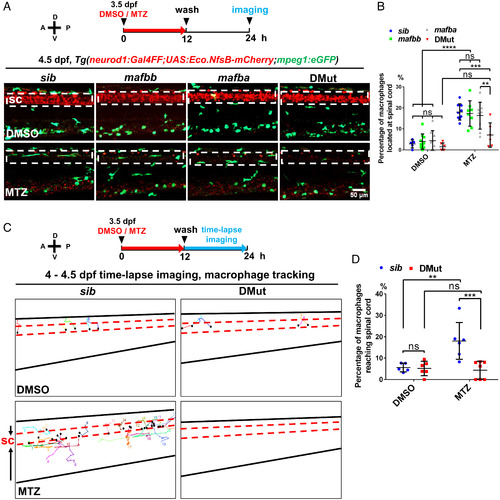
Macrophages in DMut fail to respond to the induction of neuronal apoptosis. (A) Upper Panel: schematic diagram of the workflow of neuronal cell death induction and imaging. A, anterior; P, posterior; D, dorsal; V, ventral. Lower Panel: representative images of the trunk region of 4.5 dpf siblings, mafba mutants, mafbb mutants, and DMut in Tg(neurod1:Gal4FF;UAS:Eco.NfsB-mCherry;mpeg1:eGFP) triple-transgenic background. Top groups are DMSO-treated and Bottom groups are MTZ-treated. Red and green signals represent neurons and macrophages, respectively. White dashed lines indicate the spinal cord region. sc, spinal cord. (B) Percentage of macrophages around the spinal cord region to total macrophages in siblings (n = 5 for DMSO or 9 for MTZ), mafba mutants (n = 9 for DMSO or 9 for MTZ), mafbb mutants (n = 10 for DMSO or 8 for MTZ), and DMut (n = 6 for DMSO or 6 for MTZ) treated with DMSO or MTZ at 4.5 dpf (mean ± SD; two-way ANOVA; nonsignificant [ns] P > 0.05, **P < 0.01, ***P < 0.001, ****P < 0.0001). (C) The mobilization trajectory (from 4 dpf to 4.5 dpf) of macrophages in the trunk of siblings and DMut in Tg(neurod1:Gal4FF;UAS:Eco.NfsB-mCherry;mpeg1:eGFP) triple-transgenic background after DMSO or MTZ treatment. The fish trunk and spinal cord region are indicated by black lines and red dashed lines, respectively. The numbers and black dots indicate start and end points of trajectories, respectively. (D) Percentage of macrophages reaching spinal cord to total macrophages during the imaging period (from 4 dpf to 4.5 dpf) in siblings (n = 5 for DMSO or 6 for MTZ) and DMut embryos (n = 6 for DMSO or 7 for MTZ) (mean ± SD; two-way ANOVA; nonsignificant [ns] P > 0.05, **P < 0.01, ***P < 0.001.
|
