
- Title
-
Longitudinal investigation of a xenograft tumor zebrafish model using polarization-sensitive optical coherence tomography
- Authors
- Lichtenegger, A., Tamaoki, J., Licandro, R., Mori, T., Mukherjee, P., Bian, L., Greutter, L., Makita, S., Wöhrer, A., Matsusaka, S., Kobayashi, M., Baumann, B., Yasuno, Y.
- Source
- Full text @ Sci. Rep.
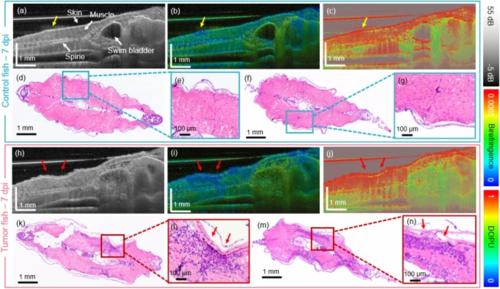
The OCT in comparison to histology results for the first generation of xenograft zebrafish at 7 days post-injection (dpi). (a–c) Scatter intensity, birefringence and DOPU sagittal cross-section images in a PBS injected control fish. The injection site is indicated by yellow arrows. (d–g) Corresponding transverse H &E-stained histology micrographs. (h–j) Scatter intensity, birefringence, and DOPU sagittal cross-section images in a tumor injected zebrafish. (k–n) Corresponding transverse H &E-stained histology images. The tumor location is indicated by red arrows. |
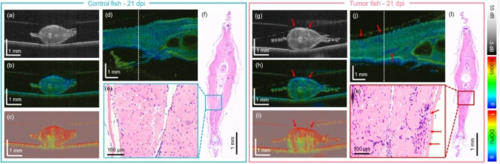
The JM-OCT in comparison to the histology results for the second generation of xenograft zebrafish at 21 days post-injection (dpi). (a–d) Scatter intensity, birefringence, DOPU transverse cross-sections and birefringence en-face image in a PBS injected control model. (e–f) H &E-stained histology micrographs in transverse direction and zoom-in image in the control animal. (g–j) Scatter intensity, birefringence, DOPU transverse cross-sections and birefringence en-face image in a tumor injected fish. (k–l) H &E-stained histology micrographs in transverse direction and zoom-in image in the tumor-bearing animal. The tumor location is indicated by red arrows. The locations of the transverse sections are indicated by white dashed lines in the en-face images. |
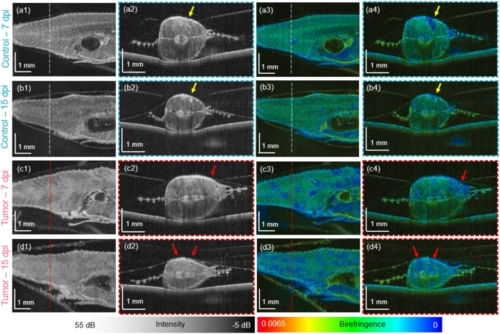
The scatter and polarization JM-OCT results over time in a control (a1–b4) and a tumor injected zebrafish (c1–d4). (a1–a2) Scatter-intensity en-face and B-scan images in a control fish at 7 days post injection (dpi). (a3–a4) Corresponding birefringence en-face and B-scan images. (b1–b2) Scatter-intensity en-face and B-scan images in a control fish at 15 dpi. (b3–b4) Corresponding birefringence en-face and B-scan images. (c1–c2) Scatter-intensity en-face and B-scan images in a tumor fish at 7 dpi. (c3–c4) Corresponding birefringence en-face and B-scan images. (d1–d2) Scatter-intensity en-face and B-scan images in a tumor fish at 15 dpi. (d3–d4) Corresponding birefringence en-face and B-scan images. |

The scatter and polarization analysis. (a) Representative scatter-intensity B-scan images of control and tumor zebrafish overlaid with the automatic muscle segmentation results (red). (b) Box-whisker plots of the mean intensity values over the five measurement days post injection (dpi) in control and tumor animals. (c,d) Box-whisker plots of the mean birefringence and DOPU values. Each data point represents the mean value of the respective quantity for each animal analyzed. |
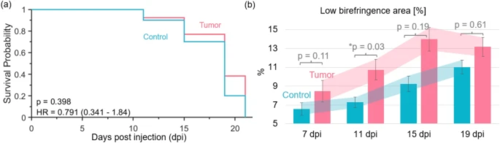
The survival and birefringence-based abnormality analysis. (a) Kaplan–Meier plot for the control and tumor zebrafish (HR—hazard ratio with 95% confidence intervals and the p-value of the log rank test are indicated). (b) Percentage of abnormal now birefringence values in the muscle region over the days post injection (dpi) with standard deviations indicated by vertical bars. |

The OCTA data analysis. (a–c) OCTA en-face projections in control animals at 7-, 15- and 19-days post injection (dpi). (d–f) OCTA en-face projections in tumor injected animals at 7-, 15- and 19-dpi. The analyzed results obtained from AngioTool37 are included in the upper left corners. (g) The mean vessel length in control and tumor injected zebrafish. (h) The vessel density in percentage in control and tumor injected zebrafish. |
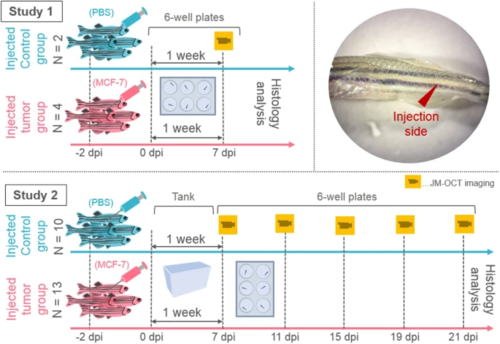
The two conducted xenograft zebrafish studies. In the first study, two control and four tumor-injected animals were investigated. In the second study, 10 and 13 control and tumor injected zebrafish, respectively were analyzed. A white-light photograph of the injection site in the tail musculature is shown (dpi—days post-injection). |

The data acquisition and processing steps with a photograph of the Jones-matrix OCT prototype. The scatter and polarization (birefringence and degree of polarization uniformity (DOPU)), and angiography (OCTA) data were analyzed. Quantitative analysis was performed based on an automatic tissue segmentation. As a ground truth histology analysis based on hematoxylin and eosin (H &E) and immunohistochemistry (IHC) staining was performed. |