
FIGURE
Fig. 1
- ID
- ZDB-FIG-220915-13
- Publication
- Lichtenegger et al., 2022 - Longitudinal investigation of a xenograft tumor zebrafish model using polarization-sensitive optical coherence tomography
- Other Figures
- All Figure Page
- Back to All Figure Page
Fig. 1
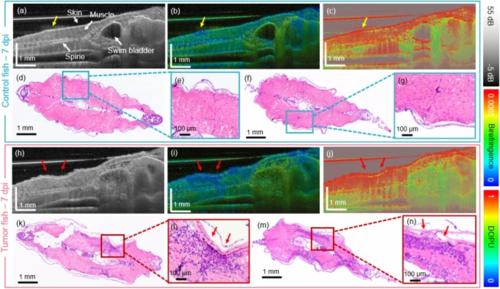
The OCT in comparison to histology results for the first generation of xenograft zebrafish at 7 days post-injection (dpi). (a–c) Scatter intensity, birefringence and DOPU sagittal cross-section images in a PBS injected control fish. The injection site is indicated by yellow arrows. (d–g) Corresponding transverse H &E-stained histology micrographs. (h–j) Scatter intensity, birefringence, and DOPU sagittal cross-section images in a tumor injected zebrafish. (k–n) Corresponding transverse H &E-stained histology images. The tumor location is indicated by red arrows. |
Expression Data
Expression Detail
Antibody Labeling
Phenotype Data
Phenotype Detail
Acknowledgments
This image is the copyrighted work of the attributed author or publisher, and
ZFIN has permission only to display this image to its users.
Additional permissions should be obtained from the applicable author or publisher of the image.
Full text @ Sci. Rep.