
FIGURE
Fig. 5
- ID
- ZDB-FIG-220915-17
- Publication
- Lichtenegger et al., 2022 - Longitudinal investigation of a xenograft tumor zebrafish model using polarization-sensitive optical coherence tomography
- Other Figures
- All Figure Page
- Back to All Figure Page
Fig. 5
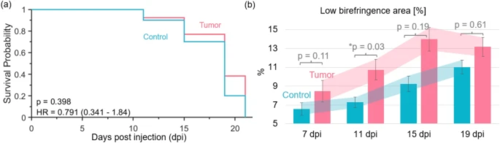
The survival and birefringence-based abnormality analysis. (a) Kaplan–Meier plot for the control and tumor zebrafish (HR—hazard ratio with 95% confidence intervals and the p-value of the log rank test are indicated). (b) Percentage of abnormal now birefringence values in the muscle region over the days post injection (dpi) with standard deviations indicated by vertical bars. |
Expression Data
Expression Detail
Antibody Labeling
Phenotype Data
Phenotype Detail
Acknowledgments
This image is the copyrighted work of the attributed author or publisher, and
ZFIN has permission only to display this image to its users.
Additional permissions should be obtained from the applicable author or publisher of the image.
Full text @ Sci. Rep.