
Image
|
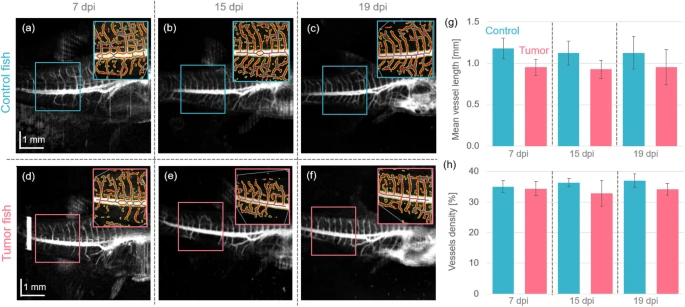
Figure Caption
Fig. 6 The OCTA data analysis. (a–c) OCTA en-face projections in control animals at 7-, 15- and 19-days post injection (dpi). (d–f) OCTA en-face projections in tumor injected animals at 7-, 15- and 19-dpi. The analyzed results obtained from AngioTool37 are included in the upper left corners. (g) The mean vessel length in control and tumor injected zebrafish. (h) The vessel density in percentage in control and tumor injected zebrafish.
Acknowledgments
This image is the copyrighted work of the attributed author or publisher, and
ZFIN has permission only to display this image to its users.
Additional permissions should be obtained from the applicable author or publisher of the image.
Full text @ Sci. Rep.