
Image
|
Figure Caption
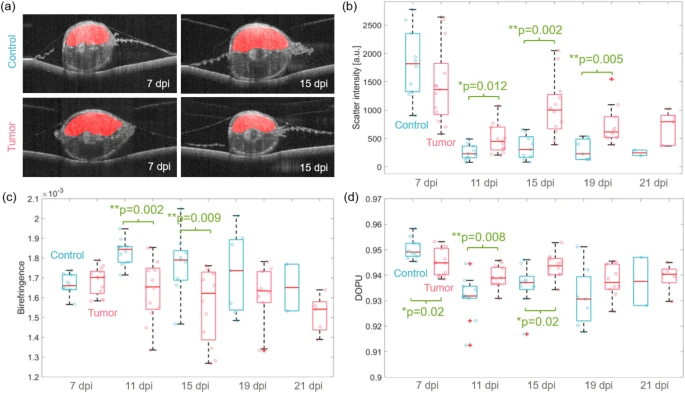
Fig. 4 The scatter and polarization analysis. (a) Representative scatter-intensity B-scan images of control and tumor zebrafish overlaid with the automatic muscle segmentation results (red). (b) Box-whisker plots of the mean intensity values over the five measurement days post injection (dpi) in control and tumor animals. (c,d) Box-whisker plots of the mean birefringence and DOPU values. Each data point represents the mean value of the respective quantity for each animal analyzed.
Acknowledgments
This image is the copyrighted work of the attributed author or publisher, and
ZFIN has permission only to display this image to its users.
Additional permissions should be obtained from the applicable author or publisher of the image.
Full text @ Sci. Rep.