
Fig. 2
- ID
- ZDB-FIG-220915-14
- Publication
- Lichtenegger et al., 2022 - Longitudinal investigation of a xenograft tumor zebrafish model using polarization-sensitive optical coherence tomography
- Other Figures
- All Figure Page
- Back to All Figure Page
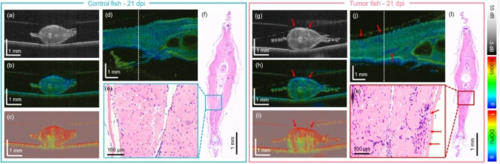
The JM-OCT in comparison to the histology results for the second generation of xenograft zebrafish at 21 days post-injection (dpi). (a–d) Scatter intensity, birefringence, DOPU transverse cross-sections and birefringence en-face image in a PBS injected control model. (e–f) H &E-stained histology micrographs in transverse direction and zoom-in image in the control animal. (g–j) Scatter intensity, birefringence, DOPU transverse cross-sections and birefringence en-face image in a tumor injected fish. (k–l) H &E-stained histology micrographs in transverse direction and zoom-in image in the tumor-bearing animal. The tumor location is indicated by red arrows. The locations of the transverse sections are indicated by white dashed lines in the en-face images. |