
Fig. 3
- ID
- ZDB-FIG-220915-15
- Publication
- Lichtenegger et al., 2022 - Longitudinal investigation of a xenograft tumor zebrafish model using polarization-sensitive optical coherence tomography
- Other Figures
- All Figure Page
- Back to All Figure Page
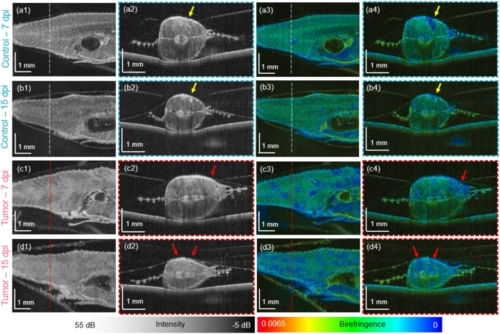
The scatter and polarization JM-OCT results over time in a control (a1–b4) and a tumor injected zebrafish (c1–d4). (a1–a2) Scatter-intensity en-face and B-scan images in a control fish at 7 days post injection (dpi). (a3–a4) Corresponding birefringence en-face and B-scan images. (b1–b2) Scatter-intensity en-face and B-scan images in a control fish at 15 dpi. (b3–b4) Corresponding birefringence en-face and B-scan images. (c1–c2) Scatter-intensity en-face and B-scan images in a tumor fish at 7 dpi. (c3–c4) Corresponding birefringence en-face and B-scan images. (d1–d2) Scatter-intensity en-face and B-scan images in a tumor fish at 15 dpi. (d3–d4) Corresponding birefringence en-face and B-scan images. |