
- Title
-
Transcriptome Profile Identifies Actin as an Essential Regulator of Cardiac Myosin Binding Protein C3 Hypertrophic Cardiomyopathy in a Zebrafish Model
- Authors
- Da'as, S.I., Hasan, W., Salem, R., Younes, N., Abdelrahman, D., Mohamed, I.A., Aldaalis, A., Temanni, R., Mathew, L.S., Lorenz, S., Yacoub, M., Nomikos, M., Nasrallah, G.K., Fakhro, K.A.
- Source
- Full text @ Int. J. Mol. Sci.
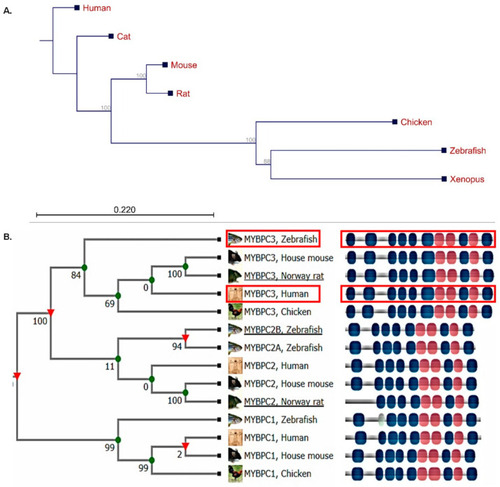
The phylogenetic tree illustrating the multiple sequence alignment analysis of the fully sequenced cardiac myosin binding protein C3 associated with hypertrophic cardiomyopathy. (A) The CLC sequence viewer program was used with the neighbor-joining method. The numbers for the interior branches were bootstrap percentages, and a branch length of the 0.22 site was given to the phylogenetic distances; the branching points in this tree structure were significant (>50% bootstrapping). (B) Human MyBP-C isoforms demonstrated evolutionary distances and conserved protein domains with the zebrafish orthologs. Red rectangle showing the human MYBPC3 and its zebrafish ortholog mypbc3 (TreeFam of the curated phylogenetic tree for animal gene families (http://www.treefam.org)). |
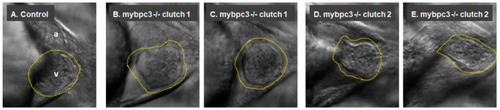
The mutant mybpc3 displayed distinct cardiac phenotypes in the zebrafish model. Representative zebrafish heart images at the ventral view at 72 hpf. (A) The control showing the cardiac chambers (atrium (a) and ventricle (v)). (B–E) The zebrafish mybpc3 mutant displayed distinct cardiac phenotypes. The zebrafish larvae from different clutches were mounted into 3% methylcellulose, and video recordings were taken using a Zeiss Axio-Zoom V16 stereomicroscope equipped with an Image Source Camera (60 frames per second) at 100× magnification, scale bar: 50 μm. A yellow traced line marks the zebrafish ventricle. PHENOTYPE:
|
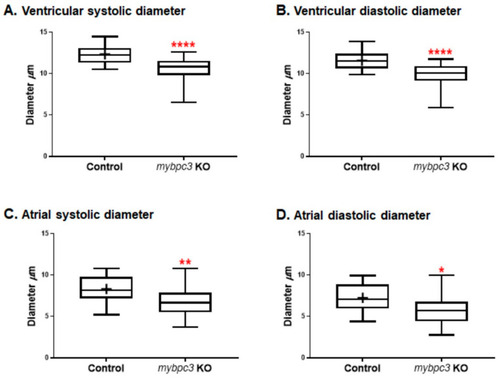
The zebrafish mybpc3 knockout (KO) model displayed restrictive physiology of the cardiac chambers at 72 h post-fertilization (hpf). (A,B) Cardiac ventricular and (C,D) cardiac atrial analysis of the zebrafish mybpc3 KO demonstrated by the measurement of diastolic/systolic diameters that were significantly decreased in comparison to the wild-type (control) group. The number of embryos analyzed for the control = 28 and mybpc3 KO = 18. The larvae were mounted to image both chambers of the heart. Cardiac function analyses were represented in Box–Whisker plots and analysis using a one-way ANOVA multiple comparisons test. Values were expressed as the means ± SE. p values of <0.05 were considered statistically significant, a value of * p < 0.05, ** p < 0.01, and **** p < 0.0001. PHENOTYPE:
|
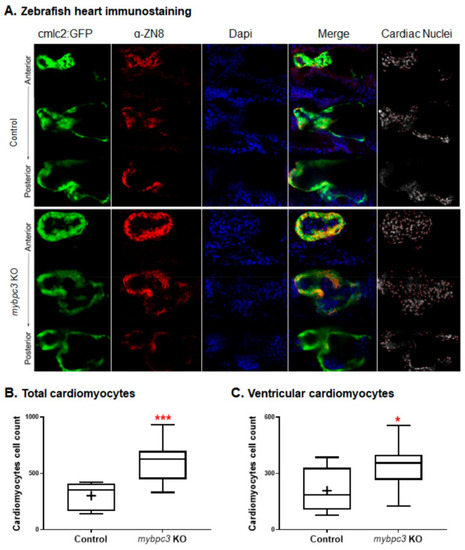
The zebrafish mybpc3 knockout (KO) displayed cardiomyocyte hyperplasia, indicated by a significantly increased total and ventricular cardiomyocytes. (A) The zebrafish control Tg (cmlc2: GFP) and mybpc3 KO staged at 72 hpf were stained with the ventricular cardiomyocyte cell surface marker, mouse anti-ZN-8 (red), and Dapi for their nuclei (blue). Heart chambers were scanned anterior to posterior using confocal microscopy at a Z-resolution of 3 μm, scale bar: 50 μm. The total cardiomyocytes and ventricular cardiomyocytes were quantified by scanning the whole heart; representative images demonstrated green hearts (Tg:cmlc2:GFP), a red ventricular cell surface, blue nucleus, merged sections, and red dots for the cell count. (B) Heart images were analyzed to count the total cardiomyocytes (green); mybpc3 KO displayed a significantly increased number of total cardiomyocyte cell nuclei compared to the control. (C) The ventricular cardiomyocyte count (red) demonstrated that mybpc3 KO significantly increased the cell nuclei of the ventricular cardiomyocytes compared to the control group. Datasets were analyzed by the t-Test using GraphPad Prism; the zebrafish group numbers analyzed were n = 9 for the control and n = 10 for mybpc3 KO. p values of <0.05 were considered statistically significant, a value of * p < 0.05 and *** p < 0.001. EXPRESSION / LABELING:
PHENOTYPE:
|
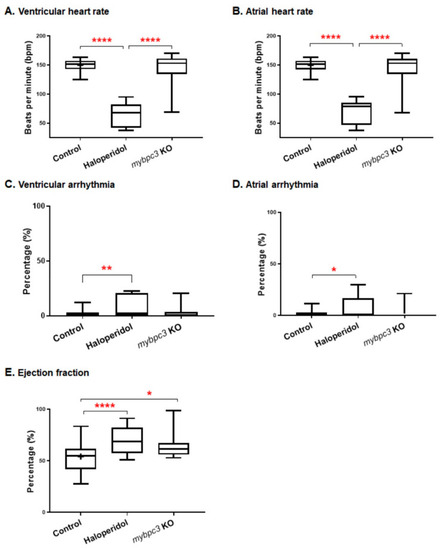
The zebrafish mybpc3 KO cardiac function parameter analysis. The analysis of the zebrafish captured videos demonstrated a variable cardiac phenotype. (A,B) Heart rate measured at ventricular and atrial contractions. The cardiac contractility functional analysis demonstrated that mybpc3 KO displayed a similar heart rate to the control group compared to the positive control group (haloperidol), which significantly impaired the heart rate. (C,D) Cardiac arrhythmia measurements of cardiac rhythm showed similar readings for both the mybpc3 KO and control group compared to the haloperidol group, which produced significant ventricular and atrial arrhythmias. (E) Ejection fraction calculation showed that the mybpc3 KO group exhibited a significantly increased percentage than the control group. The ejection fraction, calculated as the maximal dilatation (the diastolic diameter, DD) versus the maximal contraction (systolic diameter, SD), is measured in % as EF% = (DD − SD)/DDX100. Control EDD 12.33 ± 0.20 mm, n = 28; mybpc3 KO EDD 10.53 ± 0.35 mm, n = 18; p < 0.0001). ESD was also significantly decreased, but to a lesser extent (control ESD 11.57 ± 0.19 mm; mybpc3 KO ESD 9.80 ± 0.34 mm; p < 0.0001). The embryos analyzed were 28, 18, and 17 for the control, mybpc3 KO, and haloperidol groups, respectively. One-way ANOVA using GraphPad Prism software for multiple comparisons of the p-value of * p < 0.05, ** p < 0.01, and **** p < 0.0001. PHENOTYPE:
|
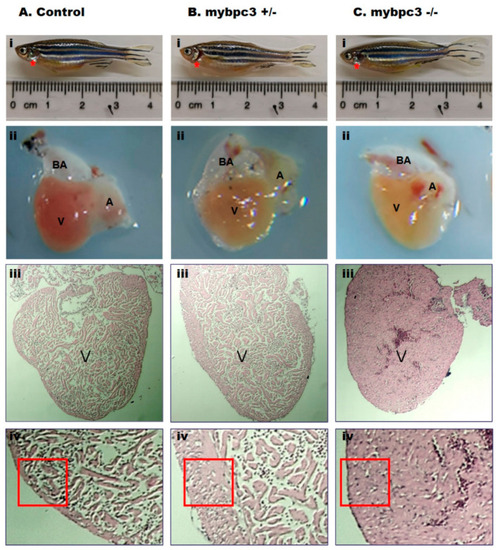
The adult zebrafish mybpc3 mutant heart anatomy and histology. Adult age-matched zebrafish hearts were dissected (location: red star) and then compared across groups: (A) Control, (B) Heterozygous mybpc3+/−, and (C) Homozygous mybpc3−/− mutant. (i). Representation of the anatomical position of the heart in the adult zebrafish. (ii). The dissected heart demonstrates the two cardiac chambers, a single atrium (A), and a single ventricle (V), with an elastic, non-contractile chamber consisting of smooth muscle bulbus arteriosus (BA). (iii). Histological organization of the adult zebrafish ventricle, magnification 80×, scale bar: 10 μm. (iv). The ventricular myocardial wall is hypertrophic in the zebrafish mybpc3 mutant model (red square) when compared to the control group subset, magnification 150×, scale bar: 10 μm. PHENOTYPE:
|
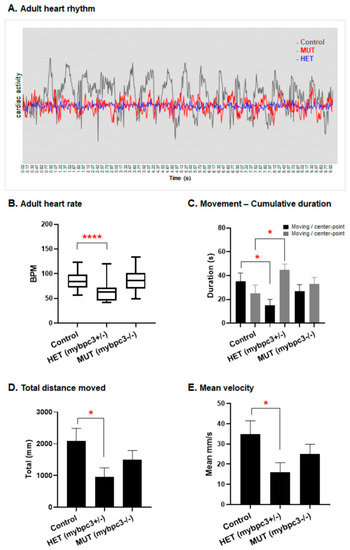
The zebrafish mybpc3 mutant adult heart function. (A) Cardiac activity percentage analyzed from oscillations in the cardiac signal at the contraction-relaxation status of the ventricle, with corresponding peaks and lows at regular intervals of contractions at the correct pace over time of a total of 10 s of video recording of beating heart. Both mybpc3+/− and mybpc3+/− groups displayed decreased amplitude. (B) Heart rate was measured in the adult zebrafish after incubation in the combined MS-222 (Tricaine methanesulfonate) and isoflurane for minimal cardiac consequence function effects. The examined adult heterozygous mybpc3+/− group (n = 35) displayed a significant reduction in heart rate, 58.36 beats per minute (BPM), **** p < 0.0001 in comparison to the control (n = 37) at 87.61 BPM and mutant mybpc3−/− (n = 40) at 88.51 BPM. The fluorescent heart of the fish was directly imaged for 10 s using a ZEISS stereomicroscope Lumar12 supplied with an Imaging source camera (Model33UX252); data are presented as mean ± SEM. (C) The calculated cumulative duration of moving rate to nonmoving was lower in the mybpc3 mutant fish. Similarly, the heterozygous mybpc3+/− group showed the lowest ratio decrease compared to the homozygous and control groups. (D,E) The maximum swimming speed and endurance experiments: the adult zebrafish mybpc3 mutant demonstrated declines in the exercise capacity. The total distance and velocity decreased significantly in the mybpc3 mutant fish. However, the heterozygous mybpc3+/− group showed a more significant decrease when compared to the control group. * p < 0.05. PHENOTYPE:
|
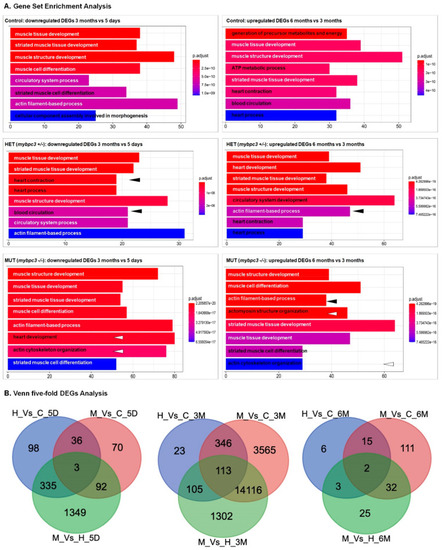
A Venn diagram illustrating the differentially expressed genes (DEGs). (A) DEGs were examined for the groups across heart development (time: 5 days, 3 months, and 6 months). (B) DEGs whose expression was changed ≥1-fold throughout normal physiologic growth (control (wild-type), red circle), or hypertrophic growth (mypbc3+/−, blue circle; mypbc3−/−, green circle). Subsections of the Venn diagram include genes that are exclusively regulated during physiologic growth, regulated during both physiologic and hypertrophic growth, and regulated exclusively during hypertrophic growth. The values listed indicate the number of genes that belong to each section. The genes that comprise each subsection of the Venn diagram are available in Supplementary Table S1 (cardiac physiologic growth), and Supplementary Table S2 (cardiac hypertrophic growth). |

Unillustrated author statements PHENOTYPE:
|