
Fig. 4
- ID
- ZDB-IMAGE-220829-68
- Genes
- Antibodies
- Publication
- Da'as et al., 2022 - Transcriptome Profile Identifies Actin as an Essential Regulator of Cardiac Myosin Binding Protein C3 Hypertrophic Cardiomyopathy in a Zebrafish Model
- All Figures
- Figures for Da'as et al., 2022
|
Fig. 4
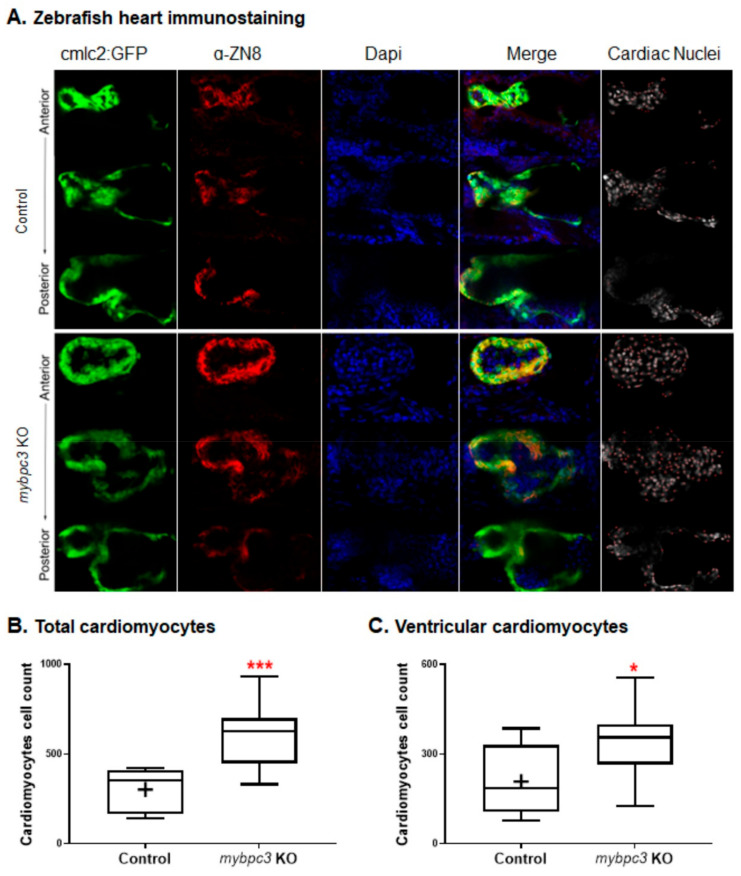
The zebrafish mybpc3 knockout (KO) displayed cardiomyocyte hyperplasia, indicated by a significantly increased total and ventricular cardiomyocytes. (A) The zebrafish control Tg (cmlc2: GFP) and mybpc3 KO staged at 72 hpf were stained with the ventricular cardiomyocyte cell surface marker, mouse anti-ZN-8 (red), and Dapi for their nuclei (blue). Heart chambers were scanned anterior to posterior using confocal microscopy at a Z-resolution of 3 μm, scale bar: 50 μm. The total cardiomyocytes and ventricular cardiomyocytes were quantified by scanning the whole heart; representative images demonstrated green hearts (Tg:cmlc2:GFP), a red ventricular cell surface, blue nucleus, merged sections, and red dots for the cell count. (B) Heart images were analyzed to count the total cardiomyocytes (green); mybpc3 KO displayed a significantly increased number of total cardiomyocyte cell nuclei compared to the control. (C) The ventricular cardiomyocyte count (red) demonstrated that mybpc3 KO significantly increased the cell nuclei of the ventricular cardiomyocytes compared to the control group. Datasets were analyzed by the t-Test using GraphPad Prism; the zebrafish group numbers analyzed were n = 9 for the control and n = 10 for mybpc3 KO. p values of <0.05 were considered statistically significant, a value of * p < 0.05 and *** p < 0.001.