
Fig. 1
- ID
- ZDB-IMAGE-220829-65
- Publication
- Da'as et al., 2022 - Transcriptome Profile Identifies Actin as an Essential Regulator of Cardiac Myosin Binding Protein C3 Hypertrophic Cardiomyopathy in a Zebrafish Model
- All Figures
- Figures for Da'as et al., 2022
|
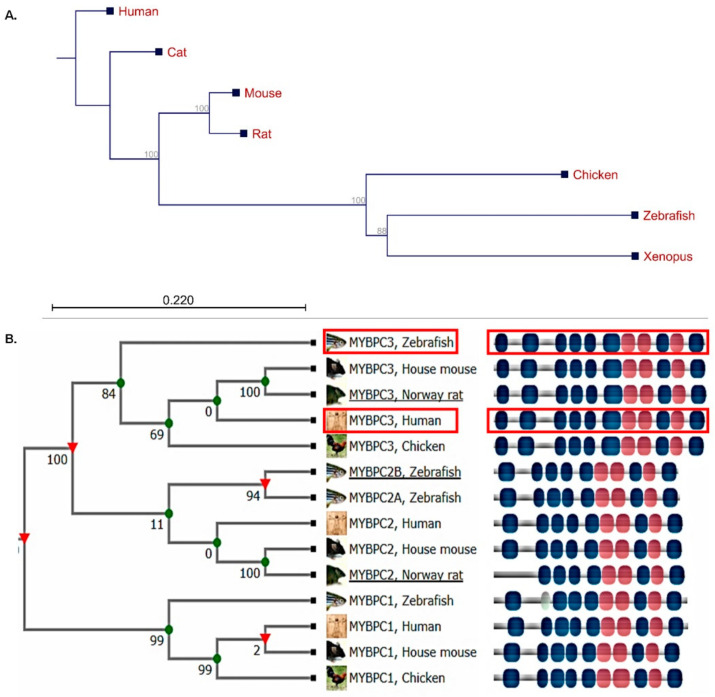
Fig. 1
The phylogenetic tree illustrating the multiple sequence alignment analysis of the fully sequenced cardiac myosin binding protein C3 associated with hypertrophic cardiomyopathy. (A) The CLC sequence viewer program was used with the neighbor-joining method. The numbers for the interior branches were bootstrap percentages, and a branch length of the 0.22 site was given to the phylogenetic distances; the branching points in this tree structure were significant (>50% bootstrapping). (B) Human MyBP-C isoforms demonstrated evolutionary distances and conserved protein domains with the zebrafish orthologs. Red rectangle showing the human MYBPC3 and its zebrafish ortholog mypbc3 (TreeFam of the curated phylogenetic tree for animal gene families (http://www.treefam.org)).