
Fig. 5
- ID
- ZDB-IMAGE-220829-69
- Publication
- Da'as et al., 2022 - Transcriptome Profile Identifies Actin as an Essential Regulator of Cardiac Myosin Binding Protein C3 Hypertrophic Cardiomyopathy in a Zebrafish Model
- All Figures
- Figures for Da'as et al., 2022
|
Fig. 5
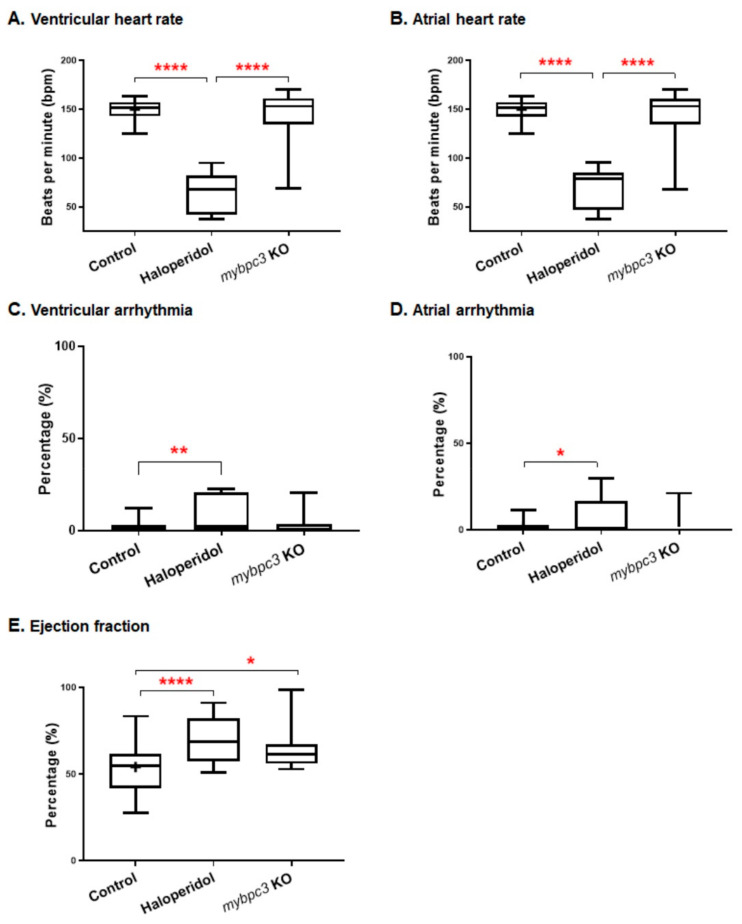
The zebrafish mybpc3 KO cardiac function parameter analysis. The analysis of the zebrafish captured videos demonstrated a variable cardiac phenotype. (A,B) Heart rate measured at ventricular and atrial contractions. The cardiac contractility functional analysis demonstrated that mybpc3 KO displayed a similar heart rate to the control group compared to the positive control group (haloperidol), which significantly impaired the heart rate. (C,D) Cardiac arrhythmia measurements of cardiac rhythm showed similar readings for both the mybpc3 KO and control group compared to the haloperidol group, which produced significant ventricular and atrial arrhythmias. (E) Ejection fraction calculation showed that the mybpc3 KO group exhibited a significantly increased percentage than the control group. The ejection fraction, calculated as the maximal dilatation (the diastolic diameter, DD) versus the maximal contraction (systolic diameter, SD), is measured in % as EF% = (DD − SD)/DDX100. Control EDD 12.33 ± 0.20 mm, n = 28; mybpc3 KO EDD 10.53 ± 0.35 mm, n = 18; p < 0.0001). ESD was also significantly decreased, but to a lesser extent (control ESD 11.57 ± 0.19 mm; mybpc3 KO ESD 9.80 ± 0.34 mm; p < 0.0001). The embryos analyzed were 28, 18, and 17 for the control, mybpc3 KO, and haloperidol groups, respectively. One-way ANOVA using GraphPad Prism software for multiple comparisons of the p-value of * p < 0.05, ** p < 0.01, and **** p < 0.0001.