
- Title
-
Bisphenol analogues induced metabolic effects through eliciting intestinal cell heterogeneous response
- Authors
- Mu, X., Qi, S., Wang, H., Yuan, L., Wang, C., Li, Y., Qiu, J.
- Source
- Full text @ Environ. Int.

Fig. 1. Long-term exposure of bisphenol analogues (from embryonic stage to 60 dpf) induced metabolic effects. a-c, Body length (a), body weight (b) and BMI (c) of zebrafish from control and bisphenol analogues treated groups. d, Hepatic glycogen concentration of zebrafish from control and bisphenol analogues treated groups. e-f, Serum (e) and hepatic (f) insulin content of zebrafish from control and bisphenol analogues treated groups. g HE staining of zebrafish liver sections from control and bisphenol analogues treated groups. Black arrows marked typical vacuolization cells. h Cholesterol contents in zebrafish liver from control and bisphenol analogues treated groups. i Triglycerides contents in zebrafish liver from control and bisphenol analogues treated groups. Asterisks denote significant differences between treatments and the control (determined by a Dunnett’s post hoc comparison; *, p < 0.05; **, p < 0.01). Error bars indicate the standard deviation. PHENOTYPE:
|
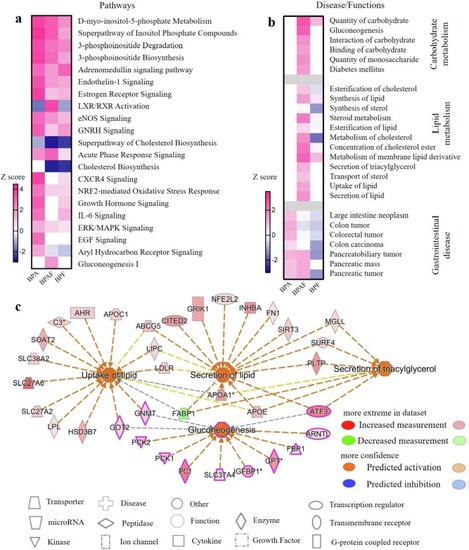
Fig. 2. Bisphenol analogues induced distinct hepatic transcriptional changes. a Heat map of significantly affected pathways post exposure of BPA, BPAF and BPF based on z score. b Heat map of significantly affected diseases/functions post exposure of BPA, BPAF and BPF based on z score. Rose represents activation; blue represents inhibition; white represents no change trend. c Network of activated metabolism functions involved in lipid and carbohydrate metabolism post BPAF exposure. (For interpretation of the references to colour in this figure legend, the reader is referred to the web version of this article.) PHENOTYPE:
|

Fig. 3. Bisphenol analogues induced intestinal damage. a AB-PAS staining of zebrafish intestinal sections from control and bisphenol analogues treated groups. Blue dye marked acidic mucus and purple dye marked neutral mucus. b-c, Intestinal mucus level in control and bisphenol analogues treated groups based on the proportion of stained area of acidic mucus (b) and neutral mucus (c). d HE staining of zebrafish intestinal sections from control and bisphenol analogues treated groups. Black arrows marked the injury of intestinal villi post exposure. e Intestinal villus width of zebrafish in control and bisphenol analogues treated groups. f-h, Protein level of three inflammatory cytokines, Il-6 (f), Tnfα (g) and Il-1β (h). Asterisks denote significant differences between treatments and the control (determined by a Dunnett’s post hoc comparison; *, p < 0.05; **, p < 0.01). Error bars indicate the standard deviation. (For interpretation of the references to colour in this figure legend, the reader is referred to the web version of this article.) PHENOTYPE:
|
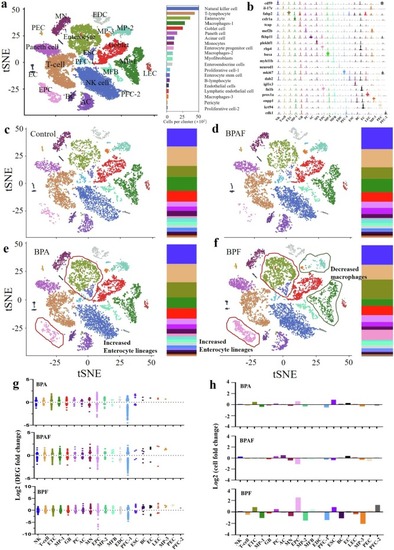
Fig. 4. 10x single-cell transcriptomic revealed the cell composition of zebrafish intestine of control and bisphenol analogues exposure groups. a t-SNE clustering of total 28,001 single cell transcriptomes with the annotation marks of each cell clusters. b Representative specifically expressed gene of each identified cell cluster. c-f t-SNE clustering of 6401 (c, control), 7698 (d, BPA), 6317 (e, BPAF) and 7585 (f, BPF) single cell transcriptomes colored by significant cell-type clusters. g, Transcriptional changes (log2(expression fold change)) in each identified cell cluster post exposure of three bisphenol analogues exposure. h Changes in the percentage (log2(ratio fold change to control)) of each identified cell cluster post exposure of three bisphenol analogues exposure. PHENOTYPE:
|
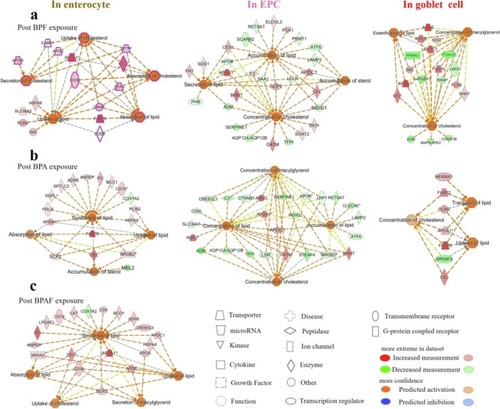
Fig. 5. Bisphenol analogues induced cross-cell types activation of lipid metabolism in zebrafish intestine. a-b Networks of lipid metabolism diseases/functions in enterocyte, enterocyte progenitor cell (EPC) and goblet cell post BPF (a) and BPA (b) exposure. c Networks of lipid metabolism diseases/functions in enterocyte post BPAF exposure. EXPRESSION / LABELING:
PHENOTYPE:
|
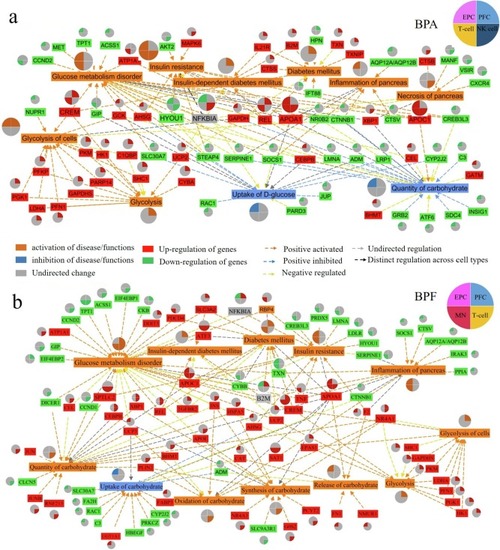
Fig.6. Bisphenol analogues altered carbohydrate metabolism in zebrafish intestinal cell types. a, Cross-cell types networks of carbohydrate metabolism diseases/functions in EPC, PFC, NK and T-cell from zebrafish intestine post BPA exposure. b, Cross-cell types networks of carbohydrate metabolism diseases/functions in EPC, PFC, MN and T-cell from zebrafish intestine post BPF exposure. PHENOTYPE:
|