
|
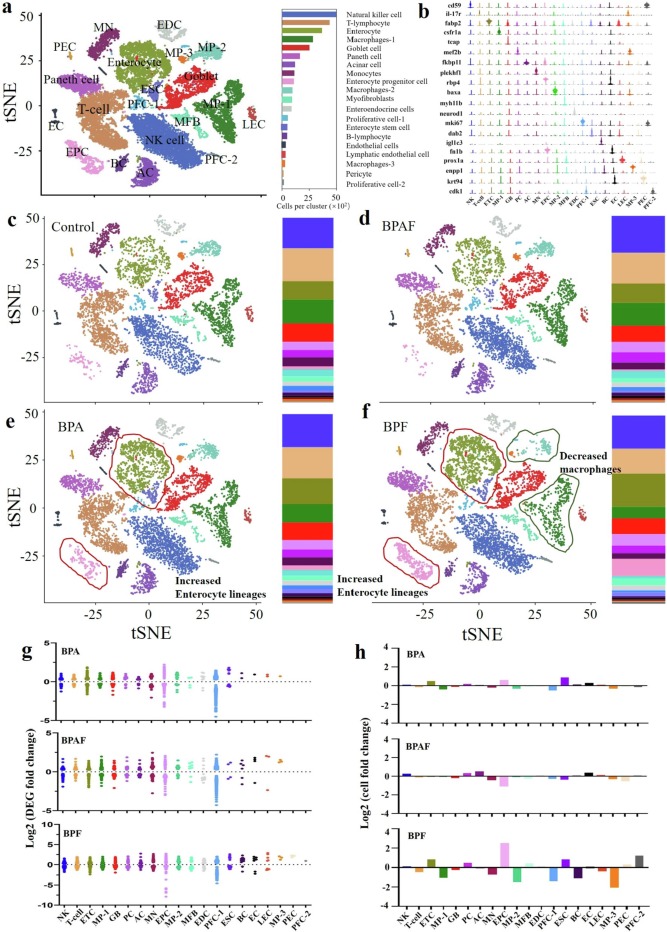
Fig. 4 Fig. 4. 10x single-cell transcriptomic revealed the cell composition of zebrafish intestine of control and bisphenol analogues exposure groups. a t-SNE clustering of total 28,001 single cell transcriptomes with the annotation marks of each cell clusters. b Representative specifically expressed gene of each identified cell cluster. c-f t-SNE clustering of 6401 (c, control), 7698 (d, BPA), 6317 (e, BPAF) and 7585 (f, BPF) single cell transcriptomes colored by significant cell-type clusters. g, Transcriptional changes (log2(expression fold change)) in each identified cell cluster post exposure of three bisphenol analogues exposure. h Changes in the percentage (log2(ratio fold change to control)) of each identified cell cluster post exposure of three bisphenol analogues exposure.