
|
Fig. 1
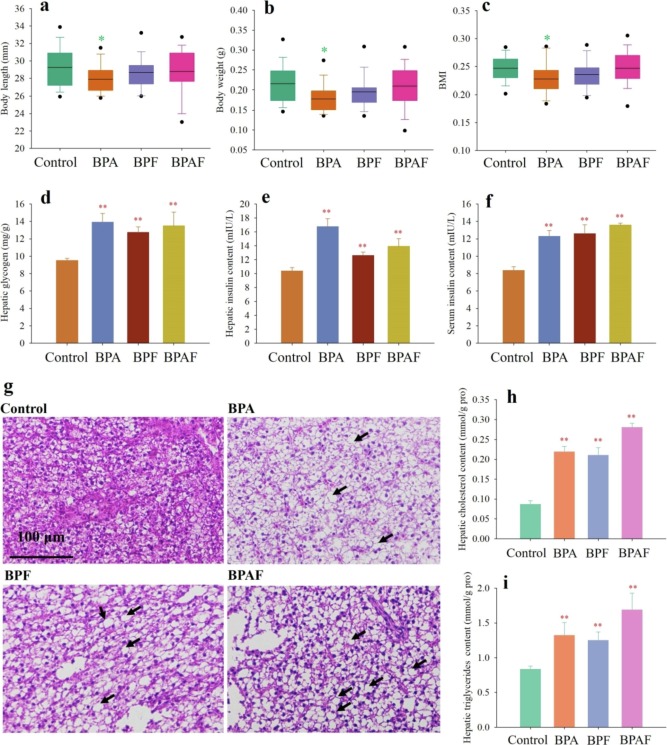
Fig. 1. Long-term exposure of bisphenol analogues (from embryonic stage to 60 dpf) induced metabolic effects. a-c, Body length (a), body weight (b) and BMI (c) of zebrafish from control and bisphenol analogues treated groups. d, Hepatic glycogen concentration of zebrafish from control and bisphenol analogues treated groups. e-f, Serum (e) and hepatic (f) insulin content of zebrafish from control and bisphenol analogues treated groups. g HE staining of zebrafish liver sections from control and bisphenol analogues treated groups. Black arrows marked typical vacuolization cells. h Cholesterol contents in zebrafish liver from control and bisphenol analogues treated groups. i Triglycerides contents in zebrafish liver from control and bisphenol analogues treated groups. Asterisks denote significant differences between treatments and the control (determined by a Dunnett’s post hoc comparison; *, p < 0.05; **, p < 0.01). Error bars indicate the standard deviation.