
|
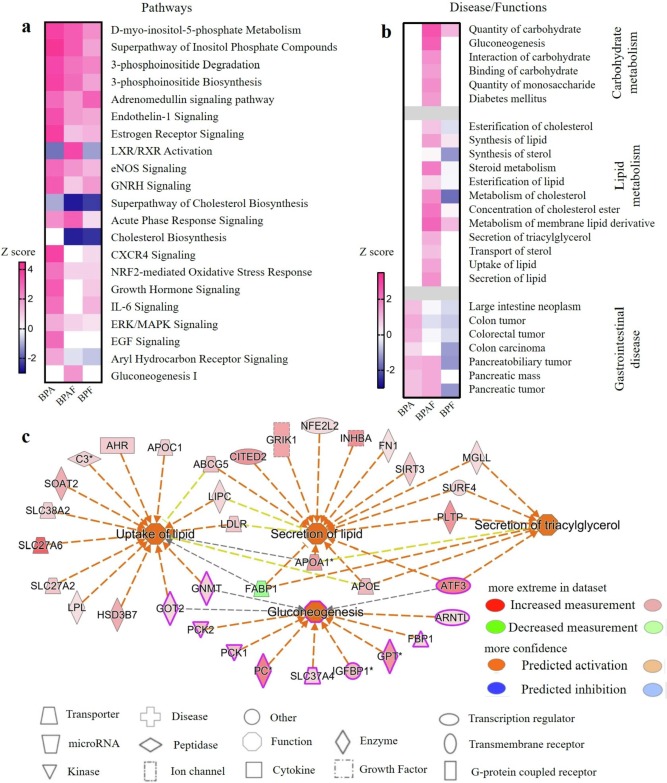
Fig. 2 Fig. 2. Bisphenol analogues induced distinct hepatic transcriptional changes. a Heat map of significantly affected pathways post exposure of BPA, BPAF and BPF based on z score. b Heat map of significantly affected diseases/functions post exposure of BPA, BPAF and BPF based on z score. Rose represents activation; blue represents inhibition; white represents no change trend. c Network of activated metabolism functions involved in lipid and carbohydrate metabolism post BPAF exposure. (For interpretation of the references to colour in this figure legend, the reader is referred to the web version of this article.)