
- Title
-
A marine sponge associated fungal metabolite monacolin X suppresses angiogenesis by down regulating VEGFR2 signaling
- Authors
- Nagabhishek, S.N., Madan Kumar, A., B, S., Balakrishnan, A., Katakia, Y.T., Chatterjee, S., Nagasundaram, N.
- Source
- Full text @ RSC Adv.
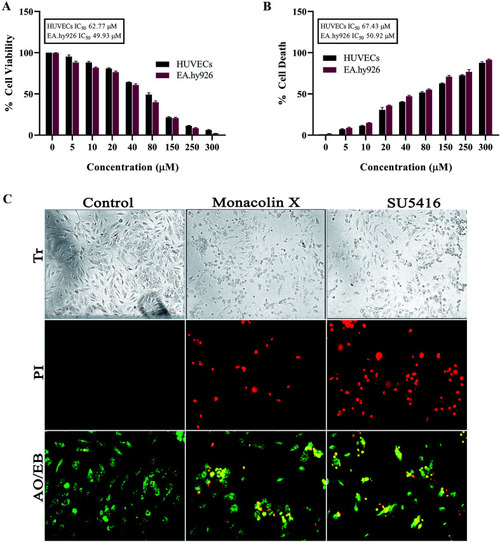
(A) Represents WST assay to check for antiproliferative and cytotoxic nature of monacolin X on human endothelial cells-HUVECs and EA.hy926. All the cells were treated with monacolin X at various concentrations (0–300 μM) for 24 h. (B) Cell membrane integrity by release of lactate dehydrogenase (LDH) activity by LDH assay. HUVECs and EA.hy926 cells were treated with monacolin X at various concentrations (0–300 μM) for 24 h. LDH released into the medium was measured along with blank, untreated cells (0 μM), had low LDH release in media and whereas treated cell had dose dependent release of LDH. (C) The morphological analysis of HUVECs treated with monacolin X at IC50 concentration (62.77 μM) for 24 h. Control, monacolin X treated and SU5416 treatment respectively. Morphological changes of control and monacolin X treated HUVECs cells evaluated with PI staining by fluorescence microscopy. The percentage of necrotic nuclei after 24 h treatment with monacolin X treated increased enormously, as revealed by nuclear condensation and fragmentation. Apoptotic and nuclear morphological changes in HUVECs cells treated with monacolin X evaluated with AO/EB dual staining. |
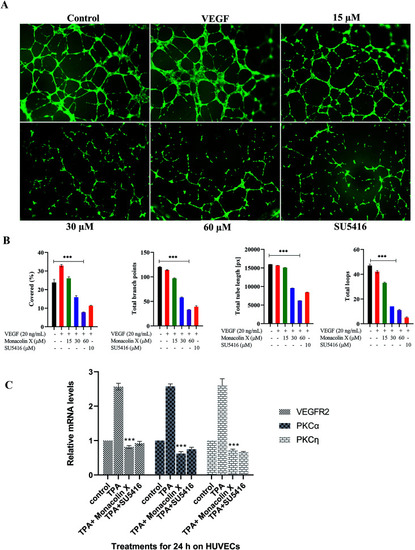
(A) Measurement of angiogenesis with the tube formation assay. HUVEC tube formation was tested with monacolin X at 3 different concentration (15 μM, 30 μM and 60 μM) and compared with standard SU5416 (magnification at 4×). (B) Total tube length (measured in pixels, px), number of branching points, number of total loops and percentage covered area (%) were measured. (C) RT-PCR gene expression results for HUVECs treated with monacolin X in presence of 10 nmol L−1 TPA (positive control). HUVEC, human umbilical vein endothelial cells. Each value represents three technical replicates of each of three biological replicates. Statistical significance of the relative normalized expression of monacolin X as compared to the non-treated cells is represented on the graph. β-actin gene was used as the reference gene for normalization and to calculate the relative expression based on 2-ΔΔCt. Data shows significantly different from positive control to that of monacolin X at ***P < 0.001. |
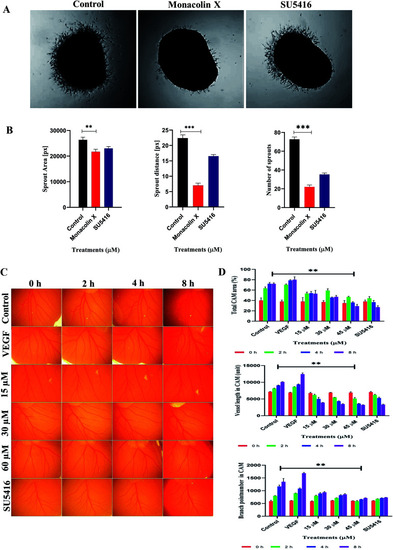
(A) Monacolin X inhibited endothelial cell sprouting in an aortic ring assay. Aortas were harvested from 12 day old chick and cut into 1 mm slices, which were then placed in 12-well plates containing matrigel. The rings were photographed and analyzed. The endothelial cell sprouting was abundant in the control aortic rings (A) but not in the rings treated with monacolin X and SU5416 suppressed the endothelial cell tube formation. All the experiments were done with the presence of VEGF (20 ng mL−1), (B) shows graphs for number of sprouts and length of capillary sprouts (μm). (C) Representative vascularization of the chorioallantoic membrane (CAM Assay) following 8 h of incubation with monacolin X at (15 μM, 30 μM and 60 μM) and compared to control and positive control (VEGF 20 ng mL−1). (D) shows the mean vessel area as a percentage of the total area, mean vessel length and mean number of branch points were obtained by Wimasis – Wimcam software. Three independent experiments were performed and the results were taken under (10×) magnification and. Each value was presented as means + SD (n = 3). *p < 0.05, **p < 0.01, ***p < 0.001 compared with control (one-way ANOVA). |
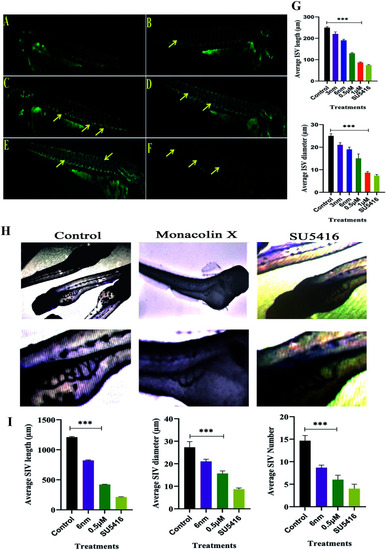
Represents panel of transgenic Tg(Kdr:EGFP)/ko1 zebrafish embryos that show green fluorescent protein (GFP) expression in endothelial cells. (A) Fluorescent images of ISV in the zebrafish embryos incubated with 0.1% DMSO (Ctrl: vehicle-control), (B–E) monacolin X 3 nm, 6 nm, 0.5 μM and 1 μM for 48 h. (F) SU5416 was used as the positive control. Yellow arrow: deformed ISV. (G) Average ISV length in (μm) and average diameter (μm). (H) Shows SIV basket stretching into the posterior yolk extension in case of control and while in monacolin X and SU5416 treatment showed significant reduction in SIV length, diameter and number of SIV. Quantification of ISV and SIV area was determined by using the NIH Image J program. (I) Shows average SIV length in (μm) and average diameter (μm) and number of SIV. All values are presented as means ± SD (n = 6). **p < 0.01, ***p < 0.001 compared with control (one-way ANOVA). |
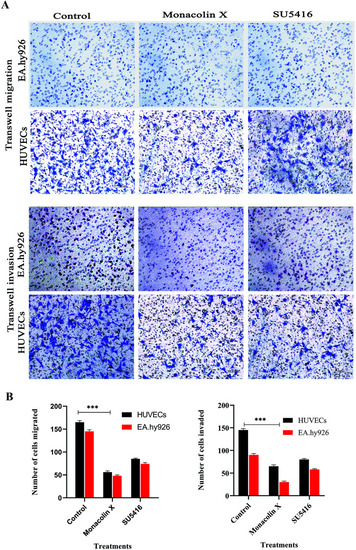
(A) Transwell migration and transwell matrigel invasion using HUVECs and EA.hy926 showed significant decrease in migration and invasion rate post monacolin X and SU5416 treatment compared to that of control. (B) Migrated and invaded cells were counted in five random fields and three independent experiments were performed and graph shows the number of migrated and invaded cells, the results were taken under (10×) magnification and the results were represented as mean ± SD (n = 5); ***p < 0.001 compared with control (one-way ANOVA). |
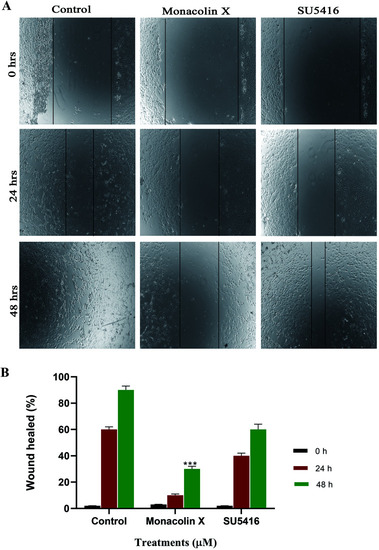
(A) Shows the antimigratory property of monacolin X and SU5416 treated on HUVECs human endothelial cells for 48 h. Significant differences between the control groups and treated groups in terms of the number of migrated cells were noted at 24 h and 48 h. Monacolin X treated group showed less number of migrated cells compared to control endothelial cells. Magnification (4×). (B) Experiments were performed in triplicate and the data are expressed as mean ± SD (n = 3); ***p < 0.001, as compared to control group were considered as significant. |
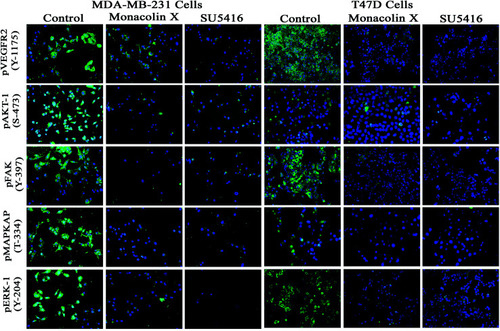
Represents immunofluorescence staining for expression of anti-pVEGFR- 2, pAKT1, pFAK, pMAPKAPK2 and pERK1 antibody marker (green), and nuclear (blue) counterstain. Control group showed significant expression but on treatment with monacolin X and SU5416 treated for 24 h showed significant decreased expression of all the phosphorylated forms in both MDA-MB-231 and T47D breast cancer cell line magnification (10×). All the experiments were done with the presence of VEGF (20 ng mL−1) experiments were performed in triplicate as compared to control group were considered as significant. |
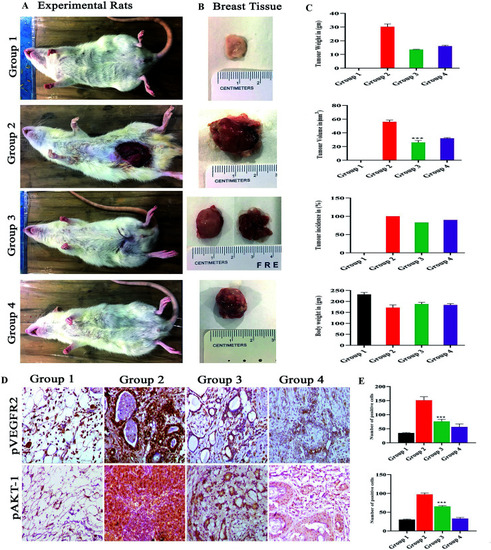
(A) Shows the representation of rats for 4 different groups of experimental rats and (B) the mammary gland morphology for all the groups. Where the control group 1 control shows normal breast morphology and group 2 DMBA induced group shows an incased tumor formed group 3 monacolin X treated post tumor induction and group 4 SU5416 treated group. Whereas the graphs (C) post treatment with monacolin X and SU5416 shows reduction in the tumor weight (gm) and volume (mm3), body weight (gm) and tumor incidence (%). (D) Shows the immunohistochemical analysis for tumor angiogenesis and survival status via pVEGFR2 and pAKT1 expression were significantly increased in the group 2 (DMBA) when compared to group 1, the treated group 3 and 4 (DMBA + monacolin X) (DMBA + SU5416) showed decreased expression levels of these proteins. The results were taken under (10×) magnification and the results were represented as mean ± SD (n = 3); ***p < 0.001 when compared with DMBA group. (E) Shows the histogram for the number of positive cells for pVEGFR2 and pAKT1. |

Fig. 9 (A) Binding modes of SU5416 and monacolin X inside the active pocket of the VEGFR2 (B) & (C) LigPlot depicting the interaction profiles of SU5416 and monacolin X with the active pocket amino acids after docking studies. |
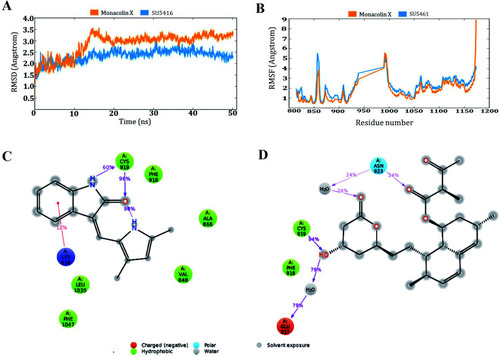
Molecular dynamic simulation results of the SU5416–receptor and monacolin X–receptor complexes: (A) deviations made by the receptor in the presence of SU5416 and monacolin X during 50 ns of simulation time. (B) Fluctuations made by the receptor amino acids in the course of the simulations. (C) & (D) Binding profiles of the SU5416 and monacolin X by end of simulations. |
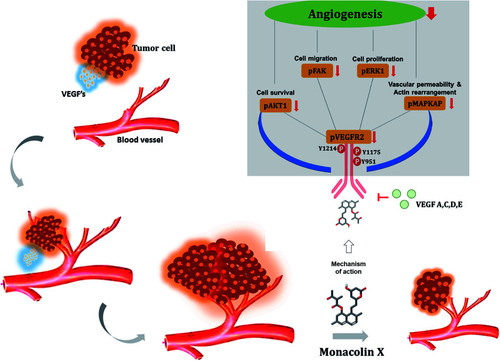
Fig. 11 Illustrates the overall mechanism of action of monacolin X on VEGFR2 in tumor angiogenesis. |