
|
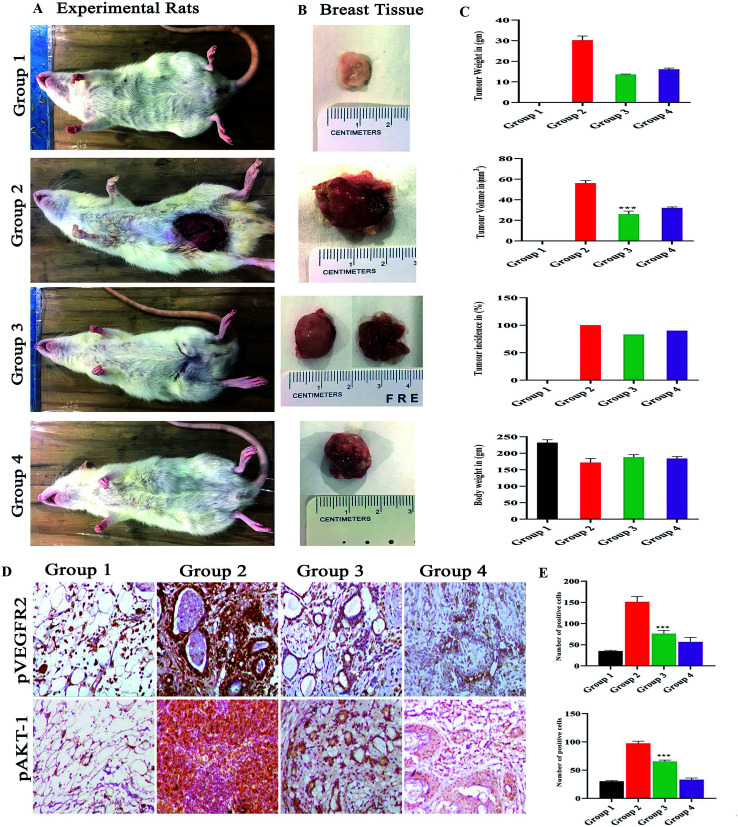
Fig. 8 (A) Shows the representation of rats for 4 different groups of experimental rats and (B) the mammary gland morphology for all the groups. Where the control group 1 control shows normal breast morphology and group 2 DMBA induced group shows an incased tumor formed group 3 monacolin X treated post tumor induction and group 4 SU5416 treated group. Whereas the graphs (C) post treatment with monacolin X and SU5416 shows reduction in the tumor weight (gm) and volume (mm3), body weight (gm) and tumor incidence (%). (D) Shows the immunohistochemical analysis for tumor angiogenesis and survival status via pVEGFR2 and pAKT1 expression were significantly increased in the group 2 (DMBA) when compared to group 1, the treated group 3 and 4 (DMBA + monacolin X) (DMBA + SU5416) showed decreased expression levels of these proteins. The results were taken under (10×) magnification and the results were represented as mean ± SD (n = 3); ***p < 0.001 when compared with DMBA group. (E) Shows the histogram for the number of positive cells for pVEGFR2 and pAKT1.