
|
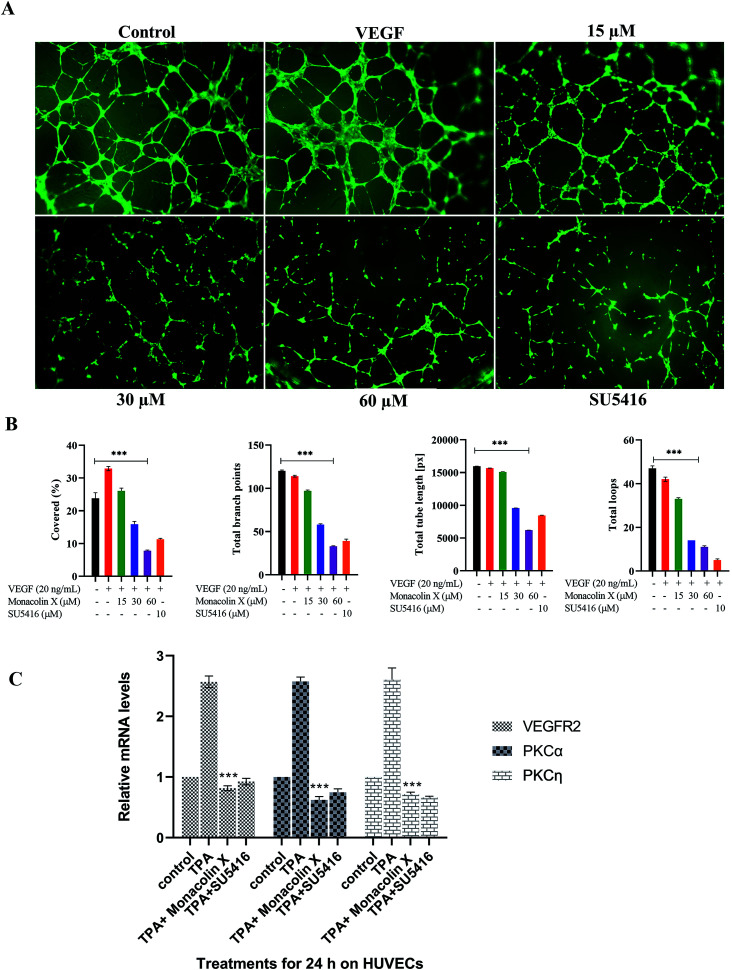
Fig. 2 (A) Measurement of angiogenesis with the tube formation assay. HUVEC tube formation was tested with monacolin X at 3 different concentration (15 μM, 30 μM and 60 μM) and compared with standard SU5416 (magnification at 4×). (B) Total tube length (measured in pixels, px), number of branching points, number of total loops and percentage covered area (%) were measured. (C) RT-PCR gene expression results for HUVECs treated with monacolin X in presence of 10 nmol L−1 TPA (positive control). HUVEC, human umbilical vein endothelial cells. Each value represents three technical replicates of each of three biological replicates. Statistical significance of the relative normalized expression of monacolin X as compared to the non-treated cells is represented on the graph. β-actin gene was used as the reference gene for normalization and to calculate the relative expression based on 2-ΔΔCt. Data shows significantly different from positive control to that of monacolin X at ***P < 0.001.