
- Title
-
DNA methylation safeguards the generation of hematopoietic stem and progenitor cells by repression of Notch signaling
- Authors
- Li, Y., Tang, C., Liu, F., Zhu, C., Liu, F., Zhu, P., Wang, L.
- Source
- Full text @ Development
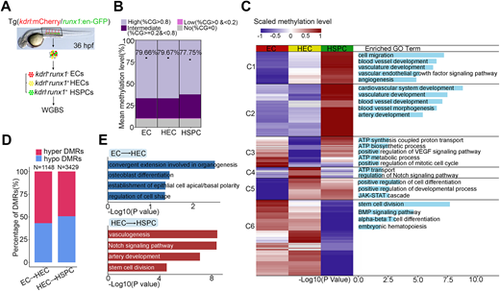
Dynamic DNA methylation during HSPC generation. (A) Flowchart of sorting and whole genome bisulfite sequencing. EC, endothelial cell; HEC, hemogenic endothelial cell; HSPC, hematopoietic stem and progenitor cell; WGBS, whole genome bisulfite sequencing. (B) Global DNA methylation levels in EC, HEC, HSPC and fraction of CpGs displaying high (>0.8), intermediate (≥0.2 and <0.8), low (>0 and <0.2) and no (=0) 5mC. n=3 replicates. (C) Heatmap displays differentially methylated regions (DMRs) in EC, HEC and HSPC. Right column shows functional enrichment of DMR-related genes by GREAT analysis. The x-axis represents the negative log of the P-values of the enrichment of the corresponding GO terms. C1-C6, Clusters 1-6. (D) The percentage of hyper-DMRs and hypo-DMRs between each two consecutive stages: EC versus HEC and HEC versus HSPC. (E) GO enrichment of DMRs by GREAT analysis between each two consecutive stages: EC versus HEC and HEC versus HSPC. The x-axis represents the negative log of the P-values of the enrichment of the corresponding GO terms. |
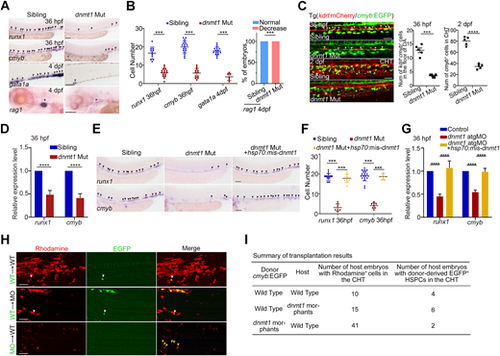
DNA methylation is required for HSPC generation. (A) Expression of HSPC markers runx1 and cmyb (arrowheads) at 36 hpf, erythroid marker gata1 (arrowheads) at 4 dpf and lymphoid marker rag1 (arrowheads) at 4 dpf in siblings and dnmt1 mutants by WISH. n≥3 replicates. (B) Quantification of WISH results in A. (C) Confocal imaging showing the number of kdrl+/cmyb+ HECs in AGM at 36 hpf (white arrowheads), and cmyb+ HSPCs in the caudal hematopoietic tissue (CHT) region at 2 dpf in siblings and dnmt1 mutants (left panels, n≥3 replicates), with quantification (right panels). n=5 embryos. (D) qPCR analysis of runx1 and cmyb expression in sibling and dnmt1 mutant embryos at 36 hpf. n=3 replicates. (E) Expression of runx1 and cmyb in sibling, dnmt1 mutant and dnmt1 mutant embryos injected with hsp70: mismatch-dnmt1-EGFP constructs. The arrowheads indicate the expression of HSPC markers runx1 and cmyb. n≥3 replicates. (F) Quantification of WISH results in E. (G) qPCR analysis of runx1 and cmyb expression in control, dnmt1 morphants and embryos co-injected with dnmt1-atgMO and hsp70: mismatch-dnmt1-EGFP constructs. n=3 replicates. (H) Transplantation results showing HSPC reconstitution in the CHT region of recipient embryos at 36 hpf. Green, cmyb+ EGFP cells; red, Rhodamine. White arrowheads show EGFP+ HSPCs contributed by donor cells; yellow arrowheads show donor-derived EGFP− hematopoietic cells in CHT region. (I) Summary of transplantation results in H. Data are mean±s.d. ***P<0.001, ****P<0.0001 (unpaired two-tailed Student's t-test). Scale bars: 100 μm (A,E); 50 μm (C,H). |
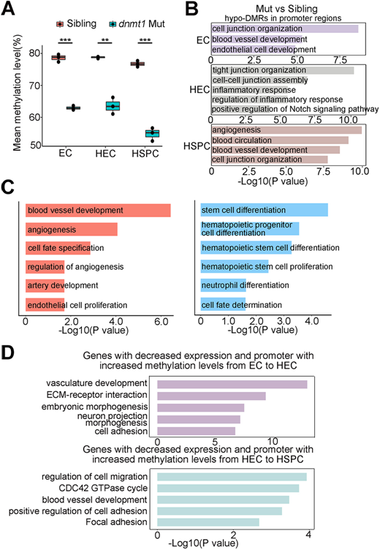
Loss of Dnmt1 deregulates endothelial programs. (A) Mean methylation level in EC, HEC and HSPC in siblings and dnmt1 mutants shows decreased methylation level upon the depletion of dnmt1. Data are mean±s.d. n=3 replicates. **P<0.01, ***P<0.001 (unpaired two-tailed Student's t-test). The boxes show the interquartile range (IQR) around median (middle line). Whiskers correspond to 1.5x IQR. Dots indicate replicates=3. (B) GO analysis of genes with hypomethylated DMRs in promoter regions in dnmt1 mutants, compared with siblings, in EC, HEC and HSPC. (C) GO enrichment of genes with differential expression showing the enrichment of upregulated (left panel) and downregulated (right panel) signaling pathways in dnmt1 mutants. (D) GO analysis of the genes inactivated during HSPC generation, while the methylation levels of their promoters increased. The x-axis represents the negative log of the P-values of the enrichment of the corresponding GO terms (B-D). |
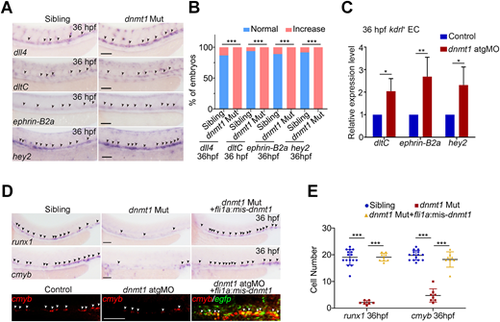
Dnmt1-mediated methylation controls HSPC generation through blocking arterial endothelial identity. (A) WISH analysis showing the expression of arterial endothelial genes dll4, dltC, ephrin-B2a and hey2 in siblings and dnmt1 mutants at 36 hpf. The arrowheads indicate the expression of corresponding arterial endothelial genes. n≥3 replicates. (B) Statistical analysis of the WISH in A. (C) qPCR analysis of arterial endothelial genes dltC, ephrin-B2a and hey2 in kdrl+ ECs in siblings and dnmt1 mutants. n=3 replicates. (D) WISH results showing expression of runx1 and cmyb (black arrowheads) at 36 hpf in sibling, dnmt1 mutant and dnmt1 mutant embryos injected with fli1a: mismatch-dnmt1-EGFP constructs (upper panels) and FISH analysis of cmyb and egfp (white arrowheads) at 36 hpf in control, dnmt1 morphants and embryos co-injected with dnmt1 atgMO and fli1a:mismatch-dnmt1-EGFP constructs showing that endothelial-derived Dnmt1-EGFP overexpression rescued the population of cmyb+ cells (bottom panel). n=3 replicates. (E) Statistical analysis of the WISH data in D. Data are mean±s.d. *P<0.05, **P<0.01 ***P<0.001 (unpaired two-tailed Student's t-test). Scale bars: 100 µm (A,D upper panels); 50 µm (D bottom panels). |
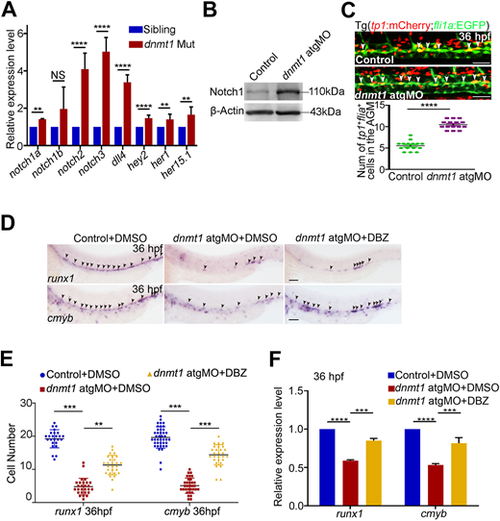
Dnmt1 represses Notch signaling to regulate HSPC generation. (A) qPCR analysis showing expression of Notch-related genes notch1a, notch1b, notch2, notch3, dll4, hey2, her1 and her15.1 in kdrl+/runx1+ HECs. n=3 replicates. (B) Protein level of Notch1 in control and dnmt1-deficient embryos at 36 hpf. (C) Confocal imaging showing the number of tp1+/fli1a+ cells in the AGM in control and dnmt1 morphants (white arrowheads, upper panels) with quantification (bottom panel). n≥3 replicates. (D) WISH analysis showing the expression of runx1 and cmyb (arrowheads) at 36 hpf in control and dnmt1 morphants treated with DMSO or DBZ. n≥3 replicates. (E) Statistical analysis of the WISH data in D. (F) qPCR analysis of runx1 and cmyb expression in control and dnmt1 morphants treated with DMSO or DBZ at 36 hpf. n=3 replicates. Data are mean±s.d. **P<0.01, ***P<0.001, ****P<0.0001 (unpaired two-tailed Student's t-test). NS, no significance. Scale bars: 50 µm (C); 100 µm (D). |
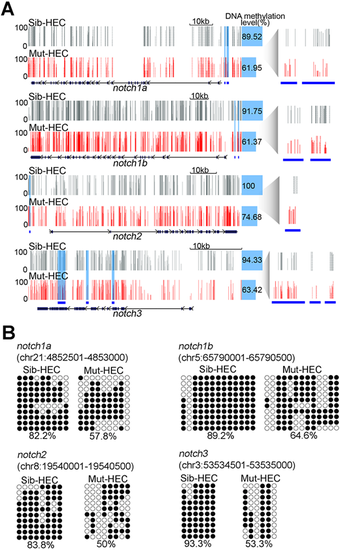
Loss of Dnmt1 reduces methylation levels of Notch genes. (A) Representative display of DNA methylation at Notch signaling-related genes in HECs in sibling and dnmt1 mutants. Blue shading and blue lines show DMRs. Each vertical line on tacks represents a 5mC site. (B) Bisulfite sequencing analysis of DNA methylation at DMRs in notch1a, notch1b, notch2 and notch3 in HECs in sibling and dnmt1 mutants. Filled circle, methylated CpG; unfilled circle, unmethylated CpG. The number underneath each sequencing diagram indicates the percentage of all methylated CpG sites over the total number of CpG sites of the sequenced colonies for each sample. |