
Fig. 3
- ID
- ZDB-IMAGE-220527-32
- Publication
- Li et al., 2022 - DNA methylation safeguards the generation of hematopoietic stem and progenitor cells by repression of Notch signaling
- All Figures
- Figures for Li et al., 2022
|
Fig. 3
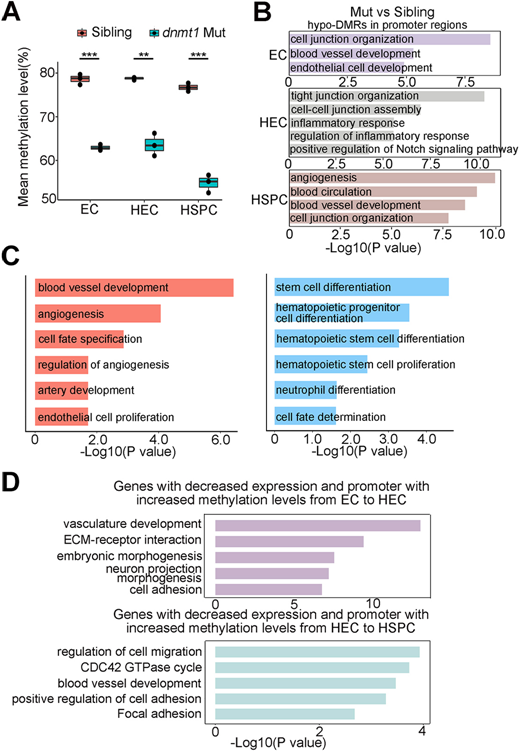
Loss of Dnmt1 deregulates endothelial programs. (A) Mean methylation level in EC, HEC and HSPC in siblings and dnmt1 mutants shows decreased methylation level upon the depletion of dnmt1. Data are mean±s.d. n=3 replicates. **P<0.01, ***P<0.001 (unpaired two-tailed Student's t-test). The boxes show the interquartile range (IQR) around median (middle line). Whiskers correspond to 1.5x IQR. Dots indicate replicates=3. (B) GO analysis of genes with hypomethylated DMRs in promoter regions in dnmt1 mutants, compared with siblings, in EC, HEC and HSPC. (C) GO enrichment of genes with differential expression showing the enrichment of upregulated (left panel) and downregulated (right panel) signaling pathways in dnmt1 mutants. (D) GO analysis of the genes inactivated during HSPC generation, while the methylation levels of their promoters increased. The x-axis represents the negative log of the P-values of the enrichment of the corresponding GO terms (B-D).