
Fig. 1
- ID
- ZDB-FIG-220527-30
- Publication
- Li et al., 2022 - DNA methylation safeguards the generation of hematopoietic stem and progenitor cells by repression of Notch signaling
- Other Figures
- All Figure Page
- Back to All Figure Page
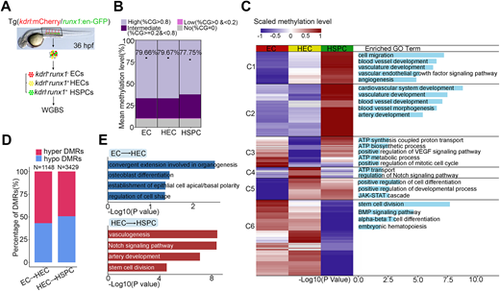
Dynamic DNA methylation during HSPC generation. (A) Flowchart of sorting and whole genome bisulfite sequencing. EC, endothelial cell; HEC, hemogenic endothelial cell; HSPC, hematopoietic stem and progenitor cell; WGBS, whole genome bisulfite sequencing. (B) Global DNA methylation levels in EC, HEC, HSPC and fraction of CpGs displaying high (>0.8), intermediate (≥0.2 and <0.8), low (>0 and <0.2) and no (=0) 5mC. n=3 replicates. (C) Heatmap displays differentially methylated regions (DMRs) in EC, HEC and HSPC. Right column shows functional enrichment of DMR-related genes by GREAT analysis. The x-axis represents the negative log of the P-values of the enrichment of the corresponding GO terms. C1-C6, Clusters 1-6. (D) The percentage of hyper-DMRs and hypo-DMRs between each two consecutive stages: EC versus HEC and HEC versus HSPC. (E) GO enrichment of DMRs by GREAT analysis between each two consecutive stages: EC versus HEC and HEC versus HSPC. The x-axis represents the negative log of the P-values of the enrichment of the corresponding GO terms. |