
Fig. 5
- ID
- ZDB-IMAGE-220527-34
- Publication
- Li et al., 2022 - DNA methylation safeguards the generation of hematopoietic stem and progenitor cells by repression of Notch signaling
- All Figures
- Figures for Li et al., 2022
|
Fig. 5
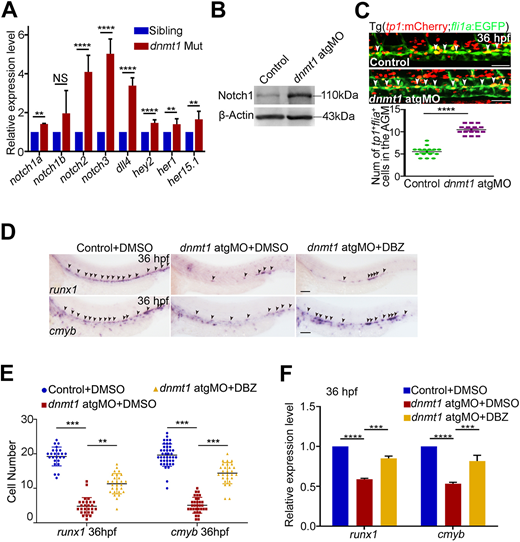
Dnmt1 represses Notch signaling to regulate HSPC generation. (A) qPCR analysis showing expression of Notch-related genes notch1a, notch1b, notch2, notch3, dll4, hey2, her1 and her15.1 in kdrl+/runx1+ HECs. n=3 replicates. (B) Protein level of Notch1 in control and dnmt1-deficient embryos at 36 hpf. (C) Confocal imaging showing the number of tp1+/fli1a+ cells in the AGM in control and dnmt1 morphants (white arrowheads, upper panels) with quantification (bottom panel). n≥3 replicates. (D) WISH analysis showing the expression of runx1 and cmyb (arrowheads) at 36 hpf in control and dnmt1 morphants treated with DMSO or DBZ. n≥3 replicates. (E) Statistical analysis of the WISH data in D. (F) qPCR analysis of runx1 and cmyb expression in control and dnmt1 morphants treated with DMSO or DBZ at 36 hpf. n=3 replicates. Data are mean±s.d. **P<0.01, ***P<0.001, ****P<0.0001 (unpaired two-tailed Student's t-test). NS, no significance. Scale bars: 50 µm (C); 100 µm (D).