
- Title
-
Functional characterization of Atlantic salmon (Salmo salar L.) PepT2 transporters
- Authors
- Vacca, F., Gomes, A.S., Murashita, K., Cinquetti, R., Roseti, C., Barca, A., Rønnestad, I., Verri, T., Bossi, E.
- Source
- Full text @ J. Physiol.
|
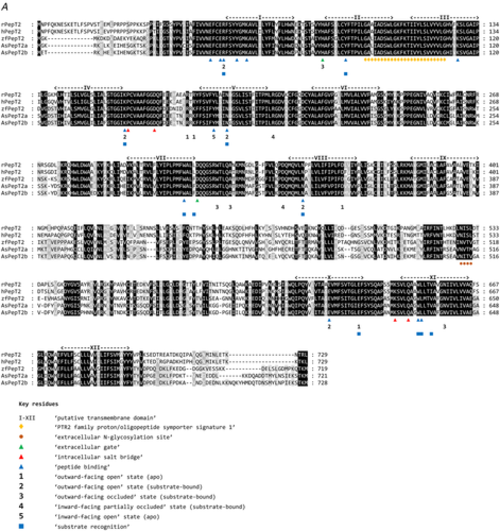
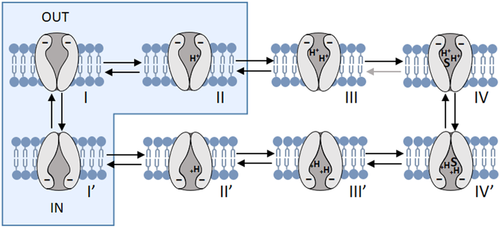
A, multiple alignments of the Atlantic salmon PepT2a (AsPepT2a) and PepT2b (AsPepT2b), zebrafish PepT2 (zfPepT2), rat PepT2 (rPepT2) and human (hPepT2) amino acid sequences as obtained by using ClustalX 2.1 and edited in GeneDoc 2.7 software. The conserved PTR2 family proton/oligopeptide symporter signature 1 (PROSITE pattern PS01022 – amino acid residues 100−124 on rPepT2 and hPepT2, and 86–110 on zPepT2, AsPepT2a and AsPepT2b) is marked by orange diamonds (♦). The putative transmembrane domains, named I to XII, were drawn using the annotation data of rPepT2 (see UniProtKB Acc. No. Q63424). Only one conserved extracellular N-glycosylation site (PROSITE pattern PS00001 – amino acid residues 528–532 on rPepT2 and hPepT2, 513–516 on zPepT2, and 511–514 on AsPepT2a and AsPepT2b), as obtained using NetNGlyc 1.0 server, is reported and marked by brown circles (●). Highlighted are key residues referring to the ‘extracellular gate’ (green triangles, ▲), ‘intracellular salt bridge’ (red triangles, ▲), and ‘peptide binding’ (blue triangles, ▲), as defined on the Cryo-EM structure of the rat PepT2 transporter (Protein Data Bank Acc. No. 7nqk.1; Parker et al., 2021). Key residues referring to the mechanism for substrate recognition and transport, as defined on the Cryo-EM structure of the human PepT2 (Protein Data Bank Acc. No. 7pmy.1) or human PepT1 (Protein Data Bank Acc. Nos. 7pn1.1, 7pmx.1 and 7pmw.1; Killer et al., 2021) are also highlighted. Amino acid residues involved in the subsequent steps of the transport cycle are shown: ‘outward-facing open’ state (apo) (1) (adapted from the human PepT1 structure, ref. Protein Data Bank Acc. No. 7pn1.1), ‘outward-facing open’ state (substrate-bound), (2) (adapted from the human PepT1 structure, ref. Protein Data Bank Acc. No. 7pmx1.1), ‘outward-facing occluded’ state (substrate-bound), (3) (adapted from the human PepT1 structure, ref. Protein Data Bank Acc. No. 7pmw1.1), ‘inward-facing partially occluded’ state (substrate-bound), (4) (adapted from the human PepT2 structure, ref. Protein Data Bank Acc. No. 7pmy1.1), ‘inward-facing open’ state (apo), (5) (from the human PepT1 Alphafold structure prediction, ref. Alphafold Acc. No. AF-P46059-F1; Jumper et al., 2021). The amino acid residues involved in ‘substrate recognition’ are all specifically indicated, marked by blue squares (■) (from the human PepT2 structure, ref. Protein Data Bank Acc. No. 7pmy1.1). Substrate: Ala-Phe. For details on transport dynamics, mechanism, states and conformations, please see Killer et al. (2021). B, three-dimensional representation of single and superposed structures of rPepT2, AsPepT2a and AsPepT2b (‘outward-facing open’ conformation) (left), and hPepT2, AsPepT2a and AsPepT2b (‘inward-facing partially occluded’ conformation) (substrate-bound; the substrate Ala-Phe is represented) (right), as obtained by using SWISS-MODEL tools. The models were built using as a template the rPepT2 (Protein Data Bank Acc. No. 7nqk.1) or the hPepT2 (Protein Data Bank Acc. No. 7pmy.1); then, the models were superposed by using the ‘Compare’ view tool. Colour schemes for single structures based on (model) confidence (it evaluates, for each residue of the model, the expected similarity to the native structure, thus representing an index of the ‘local quality’ of the residue): red, low confidence and blue, high confidence. Colour scheme for superposed structures based on consistency (it identifies local deviations of a protein structure from the ‘consensus’ established by all other structures selected for comparison): red, low consistency and green, high consistency. Percentage identities of Atlantic salmon PepT2 proteins vs. the rat (left) and human (right) PepT2 proteins are reported. [Colour figure can be viewed at wileyonlinelibrary.com]

|

The (unrooted) phylogenetic tree was constructed based on deduced PepT2 amino acid sequences using the maximum likelihood method, 1000 bootstrap replicates, and Jones-Taylor-Thornton + G matrix-based model in MEGA X. The percentage of trees in which the associated taxa clustered together is shown next to the branches. Protein Acc. Nos. for GenBank or Ensembl databases are provided next to species common name. [Colour figure can be viewed at wileyonlinelibrary.com] |
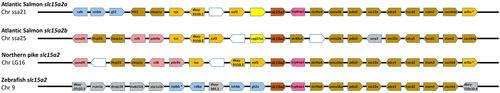
From top, slc15a2a and slc15a2b genes from Atlantic salmon (Salmo salar), slc15a2 from Northern pike (Esox lucius) and zebrafish (Danio rerio). The chromosome (Chr) number is indicated below each species name. The central pentagons in dark orange indicate the slc15a2 genes. For each slc15a2 gene, 10 flanking genes upstream and downstream are represented by different coloured pentagons. Each colour identifies sets of orthologous genes based on the degree of conservation between species and between the chromosomes within species and white pentagons represent non-identified genes. The pentagons point in the direction of transcription and only protein-coding genes are indicated. [Colour figure can be viewed at wileyonlinelibrary.com]
|
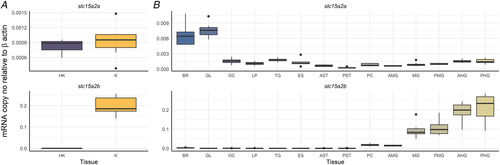
Results are shown as target slc15a2 copy number per ng of total RNA normalized using β-actin copy number per ng of total RNA. The line in the boxplot indicates the median and boxes the 1st to 3rd quartiles, whiskers mark variation outside 1st and 3rd quartiles and dots the outliers (n = 8 for all tissues, except for HK, K, GL, OC, AMG, PMG and AHG where n = 7). HK, head kidney; K, kidney; BR, brain; GL, gills; OC, olfactory cavity; TG, tongue; ES, oesophagus; AST, anterior stomach; PST, posterior stomach; PC, pyloric caeca; AMG, anterior midgut; MG, midgut; PMG, posterior midgut; AHG, anterior hindgut; PHG, posterior hindgut. [Colour figure can be viewed at wileyonlinelibrary.com]
|

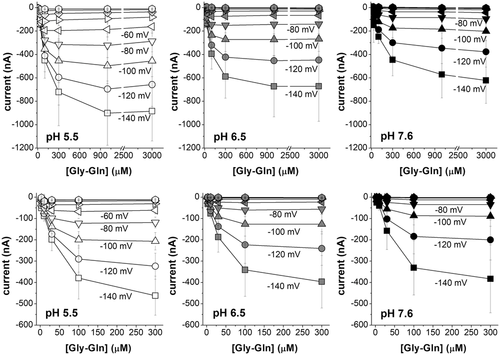
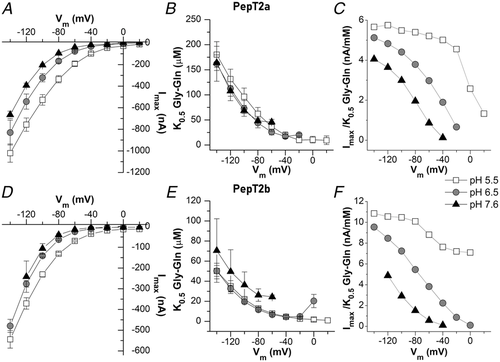
In A and C, representative traces (1 mmol l−1 Gly-Gln in NaCl solution), the dashed line represents the baseline (conventionally fixed at the value in NaCl solution at pH 7.6). B and D, current/voltage relationships (the values are the means (SD) of the current normalized to the mean value of the current at −140 mV and pH 7.6); insets, currents at pH 6.5 in the presence of 98 mmol l−1 NaCl or tetraethylammonium chloride. Data are means (SD) from 4–24 oocytes from 1–5 batches.
|

Figure 6. Box plots of the transport current values recorded as reported in Fig. 5, for PepT2a (left) and PepT2b (right) at −120 mV (A) and at −60 mV (B) Dots indicate the single oocyte transport current value. In the top part of each figure the statistical comparison between different pH conditions for each transporter is shown. In the bottom, the statistical comparison between transporters at the same pH (two-sample t test or Mann-Whitney's U test; *P < 0.05, **P < 0.01 and ***P < 0.001) is shown. Samples for box plots are the same as for Fig. 5. The detailed statistical values are reported in the statistical summary document. |
|
|

|

|
|
|