
Image
|
Figure Caption
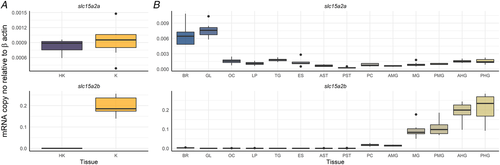
Fig. 4
Results are shown as target slc15a2 copy number per ng of total RNA normalized using β-actin copy number per ng of total RNA. The line in the boxplot indicates the median and boxes the 1st to 3rd quartiles, whiskers mark variation outside 1st and 3rd quartiles and dots the outliers (n = 8 for all tissues, except for HK, K, GL, OC, AMG, PMG and AHG where n = 7). HK, head kidney; K, kidney; BR, brain; GL, gills; OC, olfactory cavity; TG, tongue; ES, oesophagus; AST, anterior stomach; PST, posterior stomach; PC, pyloric caeca; AMG, anterior midgut; MG, midgut; PMG, posterior midgut; AHG, anterior hindgut; PHG, posterior hindgut. [Colour figure can be viewed at wileyonlinelibrary.com]
Acknowledgments
This image is the copyrighted work of the attributed author or publisher, and
ZFIN has permission only to display this image to its users.
Additional permissions should be obtained from the applicable author or publisher of the image.
Full text @ J. Physiol.