
|
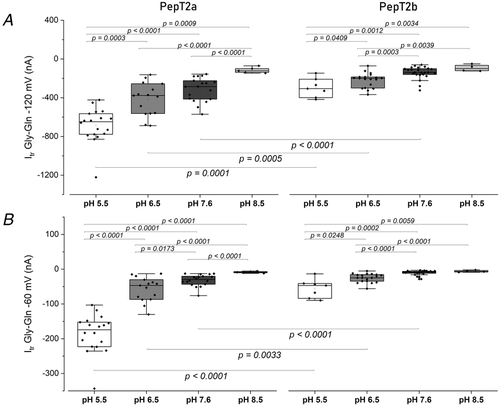
Fig. 6 Figure 6. Box plots of the transport current values recorded as reported in Fig. 5, for PepT2a (left) and PepT2b (right) at −120 mV (A) and at −60 mV (B) Dots indicate the single oocyte transport current value. In the top part of each figure the statistical comparison between different pH conditions for each transporter is shown. In the bottom, the statistical comparison between transporters at the same pH (two-sample t test or Mann-Whitney's U test; *P < 0.05, **P < 0.01 and ***P < 0.001) is shown. Samples for box plots are the same as for Fig. 5. The detailed statistical values are reported in the statistical summary document.