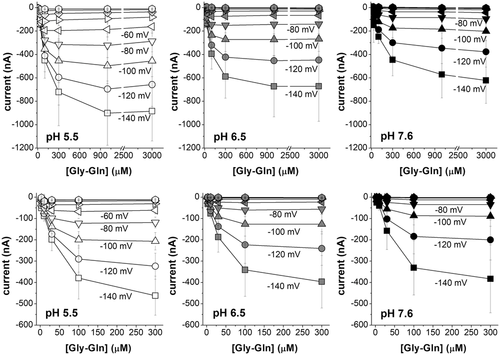
Figure 7. Current vs. substrate concentration (I/S) relationships at the indicated voltages for Atlantic salmon PepT2a in A, B and C, and for PepT2b in D, E and F
The mean value of the currents at each concentration (from 3 μmol l−1 to 3 mmol l−1 for PepT2a and from 3 μmol l−1 to 300 μmol l−1 for PepT2b) are plotted at the indicated voltage and pH. Data are means (SD) from 10–19 oocytes, obtained from 2–3 batches. The full series of the mean values (SD) for each concentration, voltage and pH are reported in the statistical summary document. The raw data are available at the link given in the data availability statement.
Expression Data
Expression Detail
Antibody Labeling
Phenotype Data
Phenotype Detail
Acknowledgments
This image is the copyrighted work of the attributed author or publisher, and
ZFIN has permission only to display this image to its users.
Additional permissions should be obtained from the applicable author or publisher of the image.
Full text @ J. Physiol.
Your Input Welcome
Thank you for submitting comments. Your input has been emailed to ZFIN curators who may contact you if
additional information is required.
Oops. Something went wrong. Please try again later.