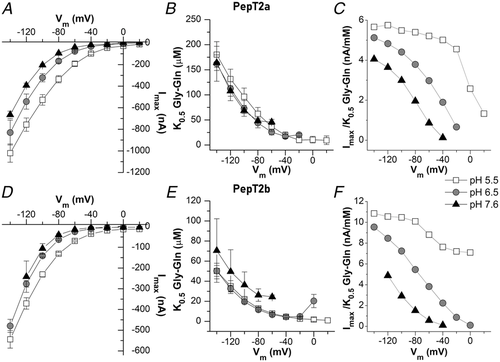
Figure 8. Dose–response analysis: Imax, K0.5 and transport efficiency of Atlantic salmon PepT2a in A, B and C, and PepT2b in D, E and F
The current values evaluated in the presence of increasing concentrations of Gly-Gln under each tested voltage (reported in Fig. 7 as means (SD)) were subsequently fitted with eqn (1) to obtain the relative maximal current (Imax) in A and D, the K0.5 in B and E, i.e. the substrate concentration that elicits half of the maximal current (Imax), and the transport efficiency in C and F, evaluated as the ratio Imax/K0.5 under each membrane potential and pH condition. Data are here reported as means (SE) result from Origin fitting. All fit values are reported in the statistical summary document. The raw data are also available at the link indicated in the data availability statement.
Expression Data
Expression Detail
Antibody Labeling
Phenotype Data
Phenotype Detail
Acknowledgments
This image is the copyrighted work of the attributed author or publisher, and
ZFIN has permission only to display this image to its users.
Additional permissions should be obtained from the applicable author or publisher of the image.
Full text @ J. Physiol.
Your Input Welcome
Thank you for submitting comments. Your input has been emailed to ZFIN curators who may contact you if
additional information is required.
Oops. Something went wrong. Please try again later.