
- Title
-
Coordinated activities of Myosin Vb isoforms and mTOR signaling regulate epithelial cell morphology during development
- Authors
- Gupta, K., Mukherjee, S., Sen, S., Sonawane, M.
- Source
- Full text @ Development
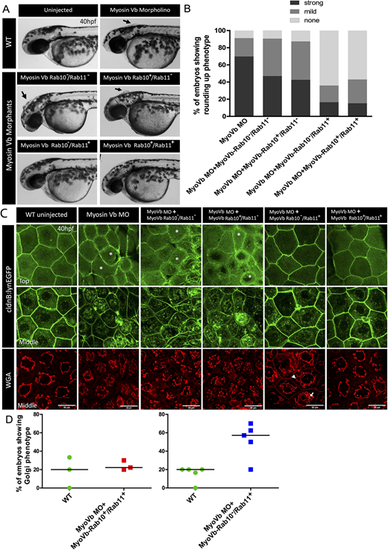
Myosin Vb-Rab11 interaction is essential to maintain cell size and shape, whereas Myosin Vb-Rab10 interaction controls trans-Golgi morphology. (A) Representative brightfield images of Myosin Vb morphants at 40 hpf, with and without compensation with mRNA encoding different Myosin Vb isoforms mentioned in the figure. (B) Graphical representation of proportion of Myosin Vb morphants (MyoVb MO) showing either strong, mild or no cell rounding phenotype upon injections of mRNA for the mentioned Myosin Vb isoforms. (C) Confocal images of the 40 hpf morphant peridermal cells in Tg(cldnB:lynEGFP) transgenic line with the membrane and the vesicles marked with Lyn-GFP and trans-Golgi marked with WGA (top panel confocal z-stack at 0 µm; middle panel z-stack at 1.9-2.2 µm). (D) Percentage of the morphant embryos showing trans-Golgi phenotype characterized by branching of trans-Golgi and the presence of large vesicles in the morphant embryos injected with mRNA for stated Myosin Vb isoforms. Black arrows in A show bunches of rounded-up cells. White arrow and arrowhead in C indicate a trans-Golgi vesicle and branch, respectively. Asterisks in C point to the absence of microridges in the apical domain of the peridermal cells. Horizontal bar shows mean. Scale bars: 20 µm (C). |

Myosin Vb Exon D knockdown results in increased trans-Golgi branching and accumulation of post-TGN vesicles in the peridermal cells. (A) Brightfield images of control and Exon D morphants (Exon D MO) at 48 hpf show that knockdown of Exon D isoform (Rab10 binding) does not result in rounded up cells in the head region. (B) Confocal images of peridermal cells of the control (Control MO) and Exon D morphants (Exon D MO) at 36 hpf immunostained for GalT-GFP and trans-Golgi using WGA. (C,D) 3D rendering of TGN by Huygen's software (C) followed by quantification (D) revealed an increase in both surface area and volume of the TGN. (E,F) Confocal stacks of control and Exon D morphants stained for trans-Golgi (WGA) and Rab10 (E) and trans-Golgi (WGA) and Rab11 (F). (G-I) Confocal micrographs of BODIPY-FL-C5-Ceramide-labeled peridermal cells from control and Exon D morphants at 36 hpf, imaged using λex=488 nm and λem at ∼515 nm (green) and ∼620 nm (red) (G) followed by quantification of number of vesicles (H), and intensity ratio of red:green fluorescence of large Ceramide-rich compartments [‘red’ appearing vesicles in overlays (G)] as well as the TGN (I). White arrows in B, E-G point to trans-Golgi vesicles in overlay panels. White arrowheads in C point to trans-Golgi branches. Data are median±interquartile range. ***P<0.001 (Mann–Whitney U test; Table S1). Scale bars: 20 µm (B,E-G); 10 µm (C). |
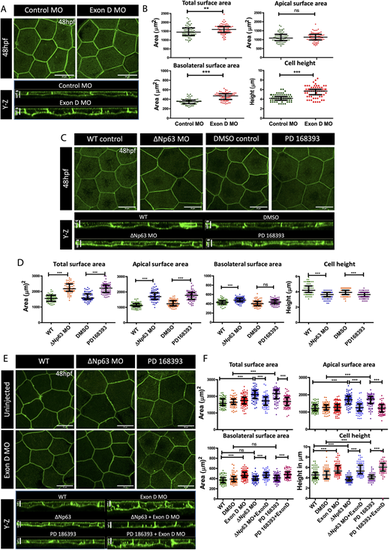
Rab10-interacting isoform of Myosin Vb regulates cell morphology during development and is essential for the apical domain expansion during compensatory cell growth. (A,C,E) Confocal scans and orthogonal (Y-Z) sections of the peridermal cells at 48 hpf of immunostained embryos of Tg(cldnB:lynEGFP) line injected with control (Control MO) and Exon D morphants (Exon D MO) (A), upon knockdown of ΔNp63 (ΔNp63 MO) and inhibition of EGF signaling by treatment with PD168393 (C) or uninjected or Exon-D morphants injected with ΔNp63 morpholino or treated with PD168393 (E). (B,D,F) Graphical representation of quantification of total, apical and basolateral surface area, and the cell height, under given genetic conditions or treatments in A,C,E, respectively. Data are median±interquartile range. **P<0.01, ***P<0.001 [Mann–Whitney U test (B); Kruskal–Wallis test with Dunn's post hoc test (D,F)]. ns, not significant. Note that only essential paired comparisons are shown in D and F using horizontal line segments. For the details of all the comparisons please refer to Table S2. Scale bars: 20 µm (X-Z plane of A,C,E, top panels); 5 µm (Y-Z plane of A,C,E, bottom panels). |
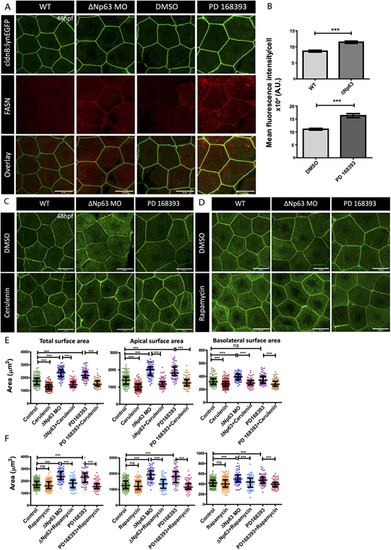
Activity of FASN and mTOR is essential for compensatory cell growth in the developing periderm. (A,B) Immunostainings using anti-FASN antibody followed by confocal imaging (A) and fluorescence intensity quantification (B) in the embryos obtained from the Tg(cldnB:lynEGFP) line that are morphants for ΔNp63 (ΔNp63 MO) or treated with PD168393, and fixed at 48 hpf. (C-F) Confocal scans (C,D) and graphical representation of the total, apical and basolateral area quantifications (E,F) in ΔNp63 morphants (ΔNp63 MO) and PD168393-treated embryos upon FASN inhibition by Cerulenin (C,E) or mTOR inhibition by Rapamycin (D,F). Data are mean±s.e.m. (B) and median±interquartile range (E,F). ***P<0.001 [Mann–Whitney U test (B); Kruskal–Wallis test with Dunn's post hoc test (E,F)]. ns, not significant. Please note that only important paired comparisons are shown. For the entire pair-wise analyses please refer to Table S3. Scale bars: 20 µm. |
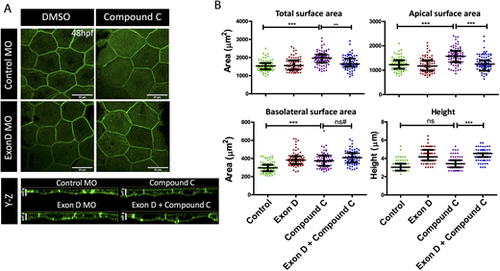
Rab10-binding MyoVb isoform functions downstream of mTOR signaling during peridermal cell growth. (A) Confocal scans of lynEGFP-labeled peridermal cells of wild-type and Exon D morphant (Exon D MO) embryos treated with Compound C and DMSO at 48 hpf. (B) Graphical representation of the quantification of the total, apical and basolateral surface area, and the cell height in given genetic conditions and treatment. Data are median±interquartile range. **P<0.01, ***P<0.001 (Kruskal–Wallis test with Dunn's post hoc test). ns, not significant. ns#, although the difference is statistically not significant (P=0.097) the increasing trend might be biologically relevant (see the main text for details). Only key pairwise comparisons are shown in B; for the rest of the comparisons please refer to Table S4. Scale bars: 20 µm. |
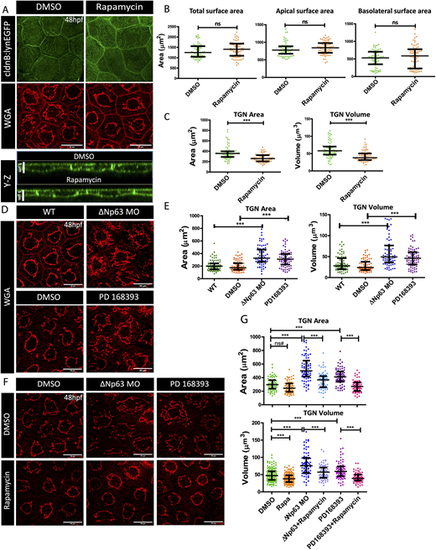
mTOR-mediated increase in the cell size corresponds to enlarged TGN size. (A) Confocal scans (X-Y and Y-Z planes) of the peridermal cells from 48 hpf embryos treated with DMSO (vehicle control) and Rapamycin and stained for lyn-EGFP and trans-Golgi (WGA). (B,C) Quantifications of total, apical and basolateral surface area (B), and TGN area and volume (C) upon Rapamycin treatment. (D,F) Confocal micrographs of TGN, labeled using WGA, from the peridermal cells from ΔNp63 morphants (ΔNp63 MO) and PD16393-treated embryos (D), and DMSO- or Rapamycin-treated ΔNp63 morphants and PD16393-treated embryos (F). (E,G) Graphical representation of TGN area and volume quantification in ΔNp63 morphants and PD16393-treated embryos (E), and DMSO or Rapamycin treated ΔNp63 morphants and PD16393-treated embryos (G). Data are median±interquartile range. ***P<0.001 [Mann–Whitney U test (B,C); Kruskal–Wallis test with Dunn's post hoc test (E,G)]. ns, not significant. ns#, although the comparison is not significant, the trend is similar to the other comparisons that have been seen to be statistically significant in other experiments (for example, in Figs 6C and 7B) performed in this study. Note that only essential pairwise comparisons are shown in panels E and G. A complete list of pairwise comparisons for B,C,E and G is given in Table S5. Scale bars: 20 µm (X-Y plane of A,D,F); 5 µm (Y-Z plane of A). |
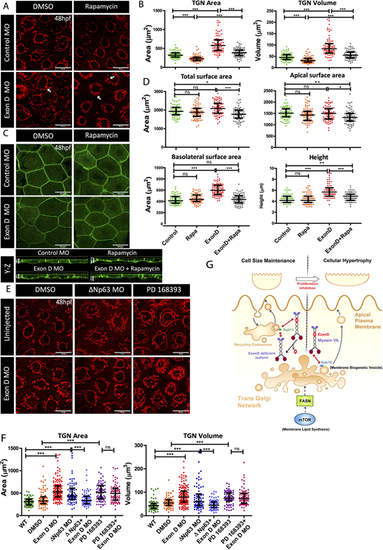
Myosin Vb and mTOR co-ordination at the TGN. (A,C) Confocal scans of the peridermal cells showing TGN (A) and cell membranes (C) of 48 hpf Tg(cldnB:lynEGFP) embryos injected with Exon D morpholino (Exon D MO) and the control embryos treated with DMSO or Rapamycin. (B,D) Quantification of the TGN surface area and volume (B) and total, apical and basolateral cell surface area and cell height (D) under different genetic conditions mentioned along the x-axes. (E,F) TGN morphologies (E) and quantifications of TGN surface area and volume (F) from the uninjected and Exon D morphant embryos either co-injected with ΔNp63 morpholino (ΔNp63 MO) or treated with PD16393 drug. (G) A schematic of Myosin Vb isoforms showing different outcomes depending upon their interaction with either Rab11 or Rab10. Although Myosin Vb-Rab11 interaction is essential to maintain the cell size during development, presumably by regulating recycling of the apical endosomes, MyosinVb-Rab 10 interaction regulates the apically directed transport from TGN downstream of the mTOR-FASN axis, during compensatory cell growth. Data are median±interquartile range. *P<0.05, **P<0.01, ***P<0.001 (Kruskal–Wallis test with Dunn's post hoc test). ns, not significant. Note that only essential pairwise comparisons are shown in the figure panels B,D and F. For the complete list of pairwise comparisons please refer to Table S6. Scale bars: 20 µm (X-Y plane of A,C,E); 5 µm (Y-Z plane of C). |