
Fig. 6
- ID
- ZDB-FIG-231215-159
- Publication
- Gupta et al., 2022 - Coordinated activities of Myosin Vb isoforms and mTOR signaling regulate epithelial cell morphology during development
- Other Figures
- All Figure Page
- Back to All Figure Page
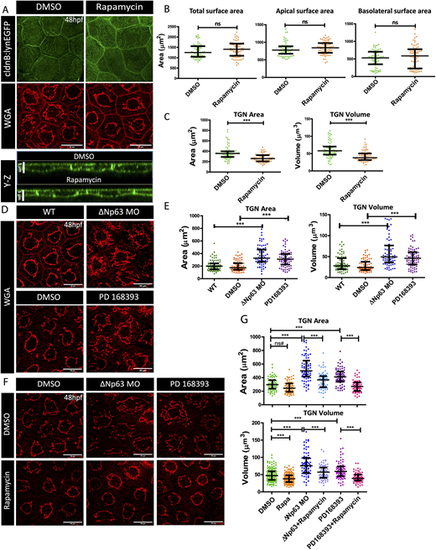
mTOR-mediated increase in the cell size corresponds to enlarged TGN size. (A) Confocal scans (X-Y and Y-Z planes) of the peridermal cells from 48 hpf embryos treated with DMSO (vehicle control) and Rapamycin and stained for lyn-EGFP and trans-Golgi (WGA). (B,C) Quantifications of total, apical and basolateral surface area (B), and TGN area and volume (C) upon Rapamycin treatment. (D,F) Confocal micrographs of TGN, labeled using WGA, from the peridermal cells from ΔNp63 morphants (ΔNp63 MO) and PD16393-treated embryos (D), and DMSO- or Rapamycin-treated ΔNp63 morphants and PD16393-treated embryos (F). (E,G) Graphical representation of TGN area and volume quantification in ΔNp63 morphants and PD16393-treated embryos (E), and DMSO or Rapamycin treated ΔNp63 morphants and PD16393-treated embryos (G). Data are median±interquartile range. ***P<0.001 [Mann–Whitney U test (B,C); Kruskal–Wallis test with Dunn's post hoc test (E,G)]. ns, not significant. ns#, although the comparison is not significant, the trend is similar to the other comparisons that have been seen to be statistically significant in other experiments (for example, in Figs 6C and 7B) performed in this study. Note that only essential pairwise comparisons are shown in panels E and G. A complete list of pairwise comparisons for B,C,E and G is given in Table S5. Scale bars: 20 µm (X-Y plane of A,D,F); 5 µm (Y-Z plane of A). |