
- Title
-
GATA4/5/6 family transcription factors are conserved determinants of cardiac versus pharyngeal mesoderm fate
- Authors
- Song, M., Yuan, X., Racioppi, C., Leslie, M., Stutt, N., Aleksandrova, A., Christiaen, L., Wilson, M.D., Scott, I.C.
- Source
- Full text @ Sci Adv
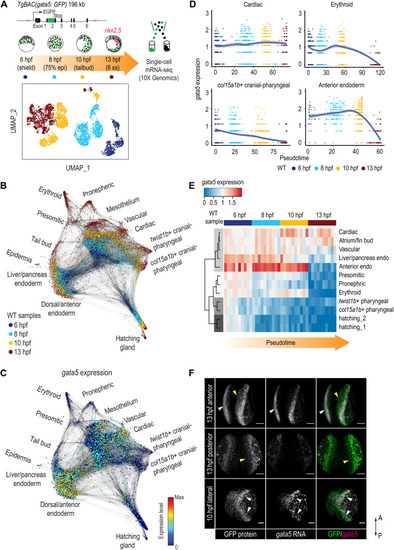
Dynamic regulation of gata5 in various mesendoderm lineages.
(A) Schematic representation of the scRNA-seq experimental design and UMAP visualization of gata5:GFP+ cells collected at four developmental time points. TgBAC(gata5:GFP) contains a 196-kb genomic region spanning the gata5 locus, with the GFP sequence inserted after the first exon of gata5. (B) Force-directed graph showing the connection between all single cells from the four WT samples. Nodes were colored by developmental time points. Edges link nodes with their neighboring cells. For each cell, up to 20 mutual nearest neighbor edges within or between time points are retained. (C) Expression of gata5 projected on the force-directed graph. (D) Pseudotemporal expression profiles of gata5 along the developmental trajectories of representative lineages (cardiac, pharyngeal_2, erythroid, and anterior endoderm). x axis, pseudotime; y axis, normalized log expression level. The smoothed lines show conditional means after local polynomial regression fitting [LOESS (locally estimated scatterplot smoothing) method] and shaded areas indicate SEs. (E) Heatmap showing gata5 expression along the developmental trajectory of major lineages. Pseudotime was scaled across all lineages for each stage. Each column represents a quantile bin of the scaled pseudotime and each row represents a lineage. gata5 expression mean was calculated for each pseudotime bin for each lineage. The row dendrogram shows the unsupervised hierarchical clustering of each lineage based on gata5 expression dynamics. (F) FISH against gata5 transcripts and immunostaining against GFP at 10 and 13 hpf. White arrowheads show cells positive for both gata5 transcripts and GFP protein; yellow arrowheads indicate cells positive for GFP protein only. A, anterior; P, posterior. Scale bars, 100 μm. |
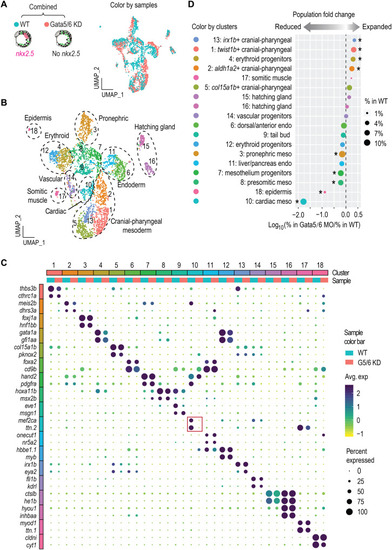
Loss of Gata5/6 leads to expansion and reduction of multiple mesoderm lineages.
(A and B) UMAP visualization of merged single-cell datasets from 13 hpf WT and Gata5/6 KD samples, colored by sample (A) or cluster IDs (B). (C) Dot plot showing the mean expression levels (color) of marker genes and the percentages of cells in which marker genes are expressed (size) in each cluster, with WT and Gata5/6 KD cells plotted separately. Red square indicates the marker gene expression in the cardiac lineage. (D) Cell composition changes of each cluster between Gata5/6 KD and WT samples. Asterisks indicate significant differences (Fisher’s exact test, Bonferroni correction, adjusted P < 0.05). Dot sizes show the percentage of each cluster within the whole WT population. |
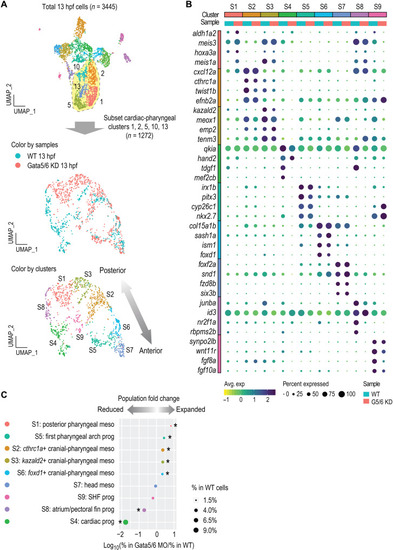
High-resolution clustering analysis of the cardiac and pharyngeal mesoderm populations.
(A) Subclustering analysis of the cardiac and pharyngeal mesoderm lineages. Clusters 1, 2, 5, 13, and 14 were subset from the combined 13 hpf dataset shown in Fig. 2 and reanalyzed. New clustering results are visualized by UMAPs that are colored by samples (top) and by cluster IDs (bottom). (B) Dot plot showing the mean expression levels (color) of marker genes and the percentages of cells in which marker genes are expressed (size) in each cluster, with WT and Gata5/6 KD cells plotted separately. (C) Cell composition changes of each cluster (after subclustering) between Gata5/6 KD and WT samples. Asterisks indicate significant differences (Fisher’s exact test, Bonferroni correction, adjusted P < 0.05). Dot sizes show the percentage of each cluster within the whole WT population (total 13 hpf WT cells). |

Specification defects of the cardiac and pharyngeal mesoderm upon Gata5/6 loss.
RNA ISH against atrial/pectoral fin progenitor marker nr2f1a (A and B), SHF marker fgf8a (C), posterior pharyngeal arch progenitor marker aldh1a2 (D), and pharyngeal arch one progenitor marker irx1b (E) in WT, Gata5/6 KD embryos, and gata5/6 mutants at 13 hpf. For each gene, quantification and quantification schematics are shown on the right side. Only the lateral staining (colored blue in the schematics) was quantified. For all staining except the anterior expression of nr2f1a, both expression intensity and expression domain sizes were quantified. Since the anterior lateral expression of nr2f1a was not detectable in Gata5/6 KD embryos, we applied the same regions of interest (ROIs) that we used in WT to measure the intensity. Arrowheads in (A), (B), and (D) indicate the lateral domains that show differential expression between WT and Gata5/6-deficient embryos. Stars in (C) denote the unaffected anterior lateral expression of fgf8a in Gata5/6 KD embryos and gata5/6 mutants. Dorsal views are shown. t test was used to determine statistical significance. ***P < 0.001; **P < 0.01; not significant (n.s.), P > 0.05. Scale bars, 100 μm. A.U., arbitrary units. |
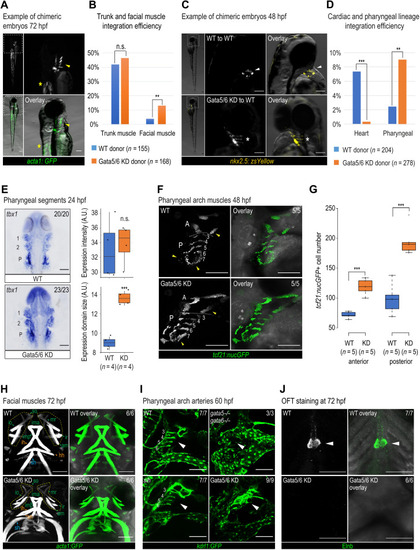
Pharyngeal arch specification and patterning defects observed at later developmental stages.
Representative chimeric embryos from transplant experiments using Tg (acta1:GFP)zf13 (A) and Tg (nkx2.5:zsYellow)fb7 (C) donors. (A) Yellow arrowheads, pharyngeal muscle; asterisks, trunk muscle. (C) White arrowheads, cardiomyocytes; asterisks, pharyngeal cells. Quantification of integration efficiency in Tg (acta1:GFP)zf13 (B) and Tg (nkx2.5:zsYellow)fb7 (D) transplant experiments. Fisher’s exact test was used. (E) tbx1 RNA ISH and quantification in WT and Gata5/6 morphants at 24 hpf. 1, pharyngeal arch 1 segment; 2, pharyngeal arch 2 segment; P, posterior pharyngeal arch segment. (F) Confocal images of tcf21+ pharyngeal muscle cells in WT and Gata5/6 morphants at 48 hpf. Yellow arrowheads, expanded anterior and posterior pharyngeal arches upon Gata5/6 loss. A, anterior pharyngeal arches; P, posterior pharyngeal arches, separated by dotted lines. (G) Quantification of tcf21: nucGFP+ cell numbers within the anterior and posterior pharyngeal arches (arches 3 to 7) at 48 hpf. t test was used. (H) Confocal images of acta1:GFP+ facial muscle in WT and Gata5/6 morphants at 72 hpf. Green arrowheads, PA1-derived muscle; orange arrowheads, PA2-derived muscle; blue arrowheads, somite-derived muscle. Yellow boxes, muscle around eyes. am, adductor mandibulae; hh, hyohyal; ih, interhyal; ima, intermandibular anterior; imp, intermandibular posterior; io, inferior oblique; ir, inferior rectus; mr, medial rectus; sh, sternohyoideus; so, superior oblique. (I) Confocal images of kdrl:GFP+ vasculature in control, Gata5/6 morphants, gata5/6 mutants, and sih mutants at 60 hpf. Arrowheads, PAA areas. (J) Confocal images of Elnb antibody staining in WT and Gata5/6 morphants. Arrowheads, OFT smooth muscle cells. ***P < 0.001; **P < 0.01; n.s., P > 0.05. Scale bars, 100 μm. |
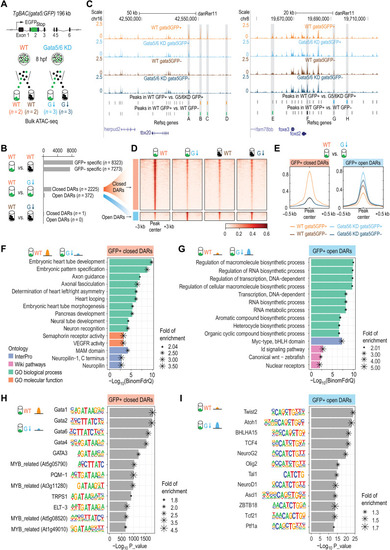
Changes of open chromatin landscapes upon loss of Gata5/6.
(A) Schematic representation of the ATAC-seq experimental design. The same BAC transgenic lines used for the scRNA-seq were used for ATAC-seq to isolate gata5:GFP+ and gata5:GFP− cells. (B) Schematic representation of the three pairwise comparisons and the numbers of DARs identified in each comparison. (C) Genome browser view of the ATAC-seq signals and peaks identified in the four different conditions at the tbx20 and foxd2 loci. The sequence coverage tracks show replicate-merged, sequence depth-normalized (counts per million) read coverage for each sample. Gray sticks, shared peaks; orange sticks, closed DARs in GFP+ cells; blue sticks, open DARs in GFP+ cells; green sticks, GFP+-specific peaks in WT; black sticks, GFP−-specific peaks in WT. A to H denote several representative differential peaks. (D) Heatmap showing the closed and open DARs identified in GFP+ cells. The read intensity within 3 kb of the peak center was plotted for each peak. (E) Aggregate plots showing the ATAC-seq signals in closed and open DARs identified in GFP+ cells. (F and G) Bar plots showing the top 10 most enriched terms (or all enriched terms if the total number < 10) obtained from GFP+ closed DARs (F) and GFP+ open DARs (G) using GREAT analysis. Terms from four categories (GO biological process, GO molecular function, InterPro, and WikiPathways) were plotted. (H and I) Motif enrichments identified by Homer within closed DARs in GFP+ cells (H) and open DARs in GFP+ cells (I). The top 12 motifs are plotted. |
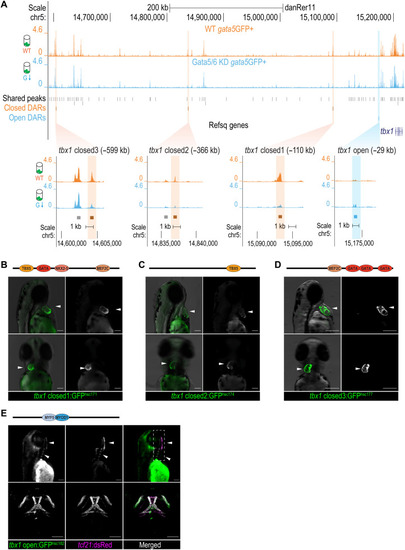
Cardiac and pharyngeal enhancer activities of DARs at the tbx1 locus.
(A) Genome browser view of the ATAC-seq signals and zoomed-in views of the DARs at tbx1 locus. The sequence coverage tracks show replicate-merged, sequence depth-normalized (counts per million) read coverage for each sample. Gray sticks, shared peaks; orange sticks, closed DARs in GFP+ cells; blue sticks, open DARs in GFP+ cells. (B to D) Fluorescent images of F2 transgenic lines at 50 to 60 hpf, generated using tbx1 closed DAR sequences: closed_1hsc172(B), closed_2hsc174(C), and closed_3hsc180(D). White arrowheads show the GFP activity in the developing heart. Cardiac TF motifs within each sequence identified via motif scans were annotated in the schematics above the fluorescent images. (E) Fluorescent (top) and confocal (bottom) images of Tg(tbx1open:GFPhsc182, tcf21:dsRedpd37) at 72 hpf. White arrowheads show GFP and dsRed signal overlays in the pharyngeal mesoderm–derived facial muscles. Head muscle TF motifs via motif scans were annotated in the schematics above the fluorescent images. The full motif scan results are shown in data S5. Scale bars, 100 μm. |

Gata4/5/6 is required to promote a cardiac and antagonize a pharyngeal muscle fate in Ciona.
(A) Summarized Ciona cardiopharyngeal lineage and expression of markers. Rounded squares, cells; arrows, cell divisions. Note the transient down-regulation of Gata4/5/6 and subsequent reactivation in FHP and SHP (first and second heart progenitors). (B) Schematic representation of cardiopharyngeal lineages at stages 24, 26, and 30. ASM ring (arrows); ATM, anterior tail muscle; black bars link sister cells. Endogenous expression of Tbx1/10 at stage 24 (C) and Ebf at stage 26 (E) visualized by ISH (green) in control (TyrosinaseCRISPR) and Gata4/5/6CRISPR knockout embryos. Proportions of embryos expressing Tbx1/10 (D) and Ebf (F) transcripts in indicated cell-type progenitors. (D) STVC only (Tyr: 97%, n = 48; Gata4/5/6CRISPR: 66%, n = 31), both STVC and FHP (Tyr: 3%, n = 3; Gata4/5/6CRISPR: 34%, n = 16). (F) ASMF only (Tyr: 100%, n = 70), both ASMF and SHP-FHP (Tyr: 0%, Gata4/5/6CRISPR: 43% ± 3% SE; n = 65). Nuclei, red; cell membranes, blue. (G) Target overexpression of Gata4/5/6 in cardiopharyngeal progenitor cells. B7.5 lineage cells, red. ASMP, atrial siphon muscle precursor cells. (H) Proportions of embryos with normal or reduced numbers of Ebf-expressing ASMPs. Control: 20% (n = 98), Gata4/5/6OE: 68 ± 3% SE (n = 118) reduced Ebf-expressing ASMPs. Fisher’s exact test was used. White asterisks, central nervous system (CNS). Scale bars, 10 or 15 μm (zoomed-in views). |
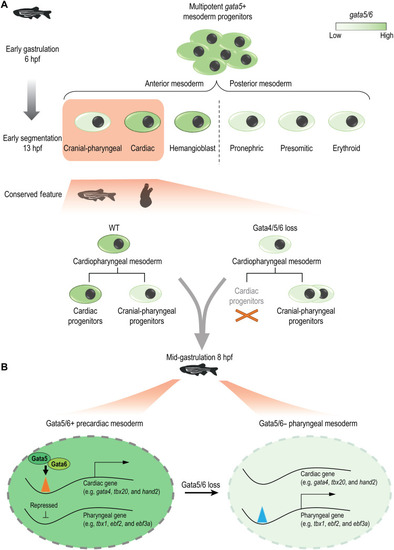
An evolutionarily conserved GATA4/5/6 regulatory axis regulates cardiac and pharyngeal mesoderm fate balance.
(A) Loss of Gata4/5/6 family TFs in zebrafish and Ciona results in a bias to a pharyngeal fate, which requires down-regulation of Gata4/5/6 expression in a WT-like context. (B) Gata5/6 promotes the accessibility of enhancers near cardiac genes (e.g., gata4, tbx20, and hand2) while repressing that of the pharyngeal enhancers (e.g., tbx1, ebf2, and ebf3a) in the precardiac mesoderm. In the pharyngeal mesoderm, where gata5/6 is down-regulated, the repression of the pharyngeal enhancers is removed. |