
Fig. 6
- ID
- ZDB-IMAGE-220823-6
- Publication
- Song et al., 2022 - GATA4/5/6 family transcription factors are conserved determinants of cardiac versus pharyngeal mesoderm fate
- All Figures
- Figures for Song et al., 2022
|
Fig. 6
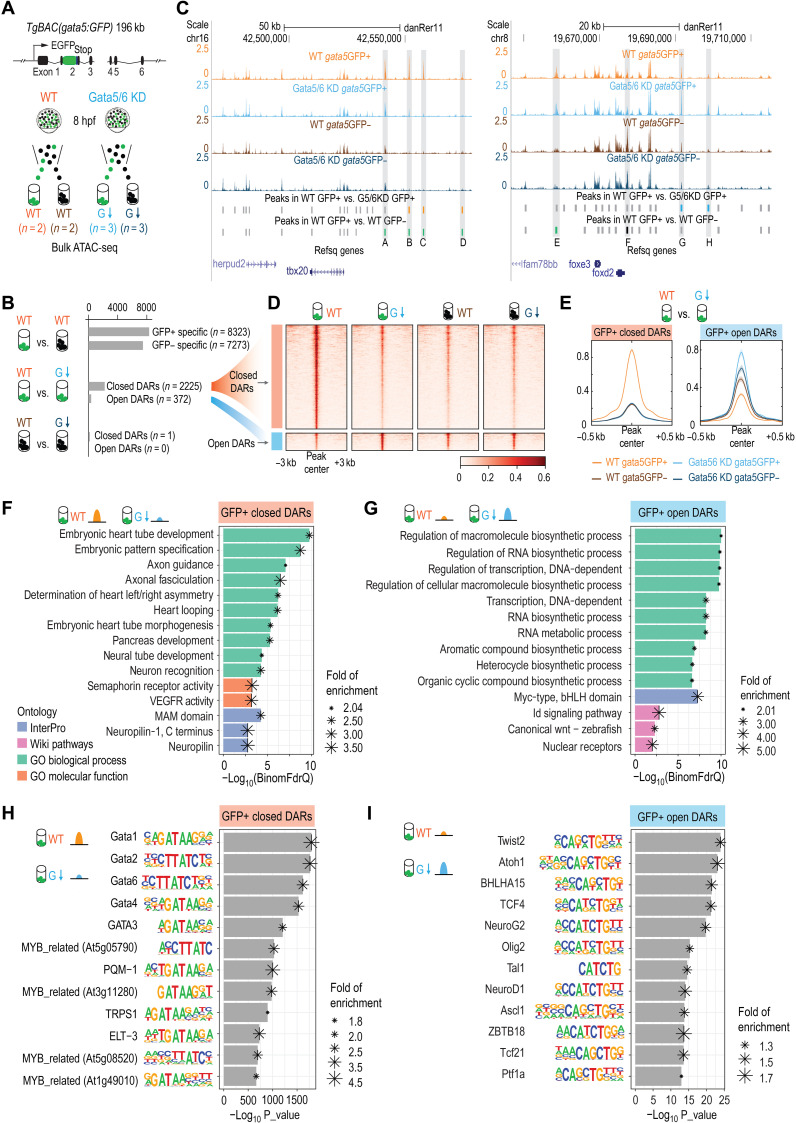
(A) Schematic representation of the ATAC-seq experimental design. The same BAC transgenic lines used for the scRNA-seq were used for ATAC-seq to isolate gata5:GFP+ and gata5:GFP− cells. (B) Schematic representation of the three pairwise comparisons and the numbers of DARs identified in each comparison. (C) Genome browser view of the ATAC-seq signals and peaks identified in the four different conditions at the tbx20 and foxd2 loci. The sequence coverage tracks show replicate-merged, sequence depth-normalized (counts per million) read coverage for each sample. Gray sticks, shared peaks; orange sticks, closed DARs in GFP+ cells; blue sticks, open DARs in GFP+ cells; green sticks, GFP+-specific peaks in WT; black sticks, GFP−-specific peaks in WT. A to H denote several representative differential peaks. (D) Heatmap showing the closed and open DARs identified in GFP+ cells. The read intensity within 3 kb of the peak center was plotted for each peak. (E) Aggregate plots showing the ATAC-seq signals in closed and open DARs identified in GFP+ cells. (F and G) Bar plots showing the top 10 most enriched terms (or all enriched terms if the total number < 10) obtained from GFP+ closed DARs (F) and GFP+ open DARs (G) using GREAT analysis. Terms from four categories (GO biological process, GO molecular function, InterPro, and WikiPathways) were plotted. (H and I) Motif enrichments identified by Homer within closed DARs in GFP+ cells (H) and open DARs in GFP+ cells (I). The top 12 motifs are plotted.