
Fig. 7
- ID
- ZDB-IMAGE-220823-7
- Publication
- Song et al., 2022 - GATA4/5/6 family transcription factors are conserved determinants of cardiac versus pharyngeal mesoderm fate
- All Figures
- Figures for Song et al., 2022
|
Fig. 7
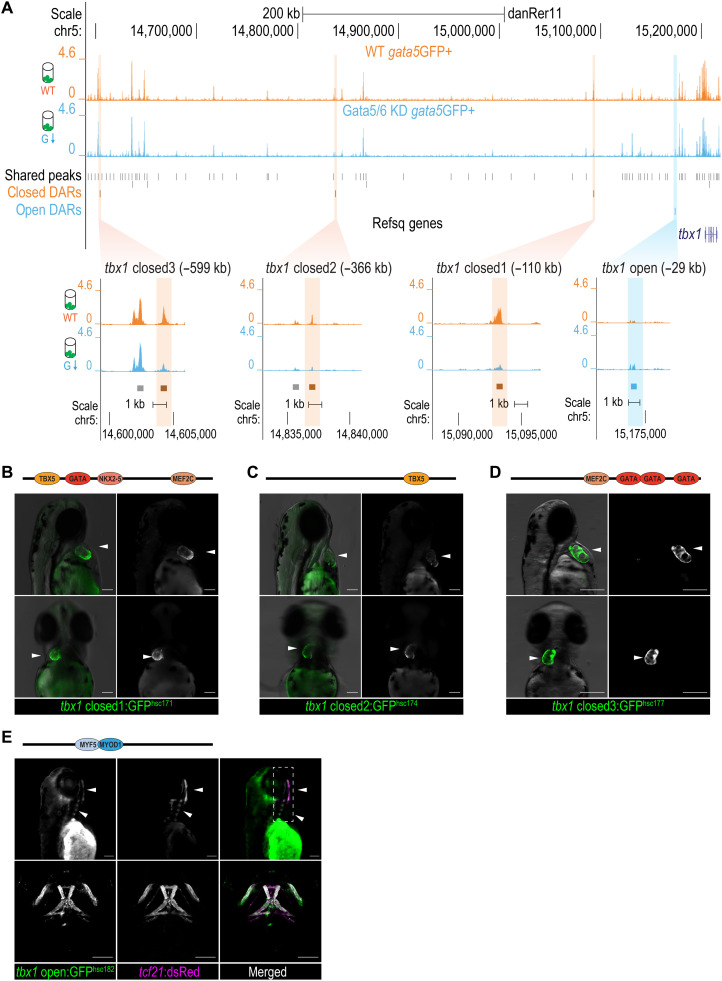
(A) Genome browser view of the ATAC-seq signals and zoomed-in views of the DARs at tbx1 locus. The sequence coverage tracks show replicate-merged, sequence depth-normalized (counts per million) read coverage for each sample. Gray sticks, shared peaks; orange sticks, closed DARs in GFP+ cells; blue sticks, open DARs in GFP+ cells. (B to D) Fluorescent images of F2 transgenic lines at 50 to 60 hpf, generated using tbx1 closed DAR sequences: closed_1hsc172(B), closed_2hsc174(C), and closed_3hsc180(D). White arrowheads show the GFP activity in the developing heart. Cardiac TF motifs within each sequence identified via motif scans were annotated in the schematics above the fluorescent images. (E) Fluorescent (top) and confocal (bottom) images of Tg(tbx1open:GFPhsc182, tcf21:dsRedpd37) at 72 hpf. White arrowheads show GFP and dsRed signal overlays in the pharyngeal mesoderm–derived facial muscles. Head muscle TF motifs via motif scans were annotated in the schematics above the fluorescent images. The full motif scan results are shown in data S5. Scale bars, 100 μm.