
Fig. 1
- ID
- ZDB-IMAGE-220823-1
- Publication
- Song et al., 2022 - GATA4/5/6 family transcription factors are conserved determinants of cardiac versus pharyngeal mesoderm fate
- All Figures
- Figures for Song et al., 2022
|
Fig. 1
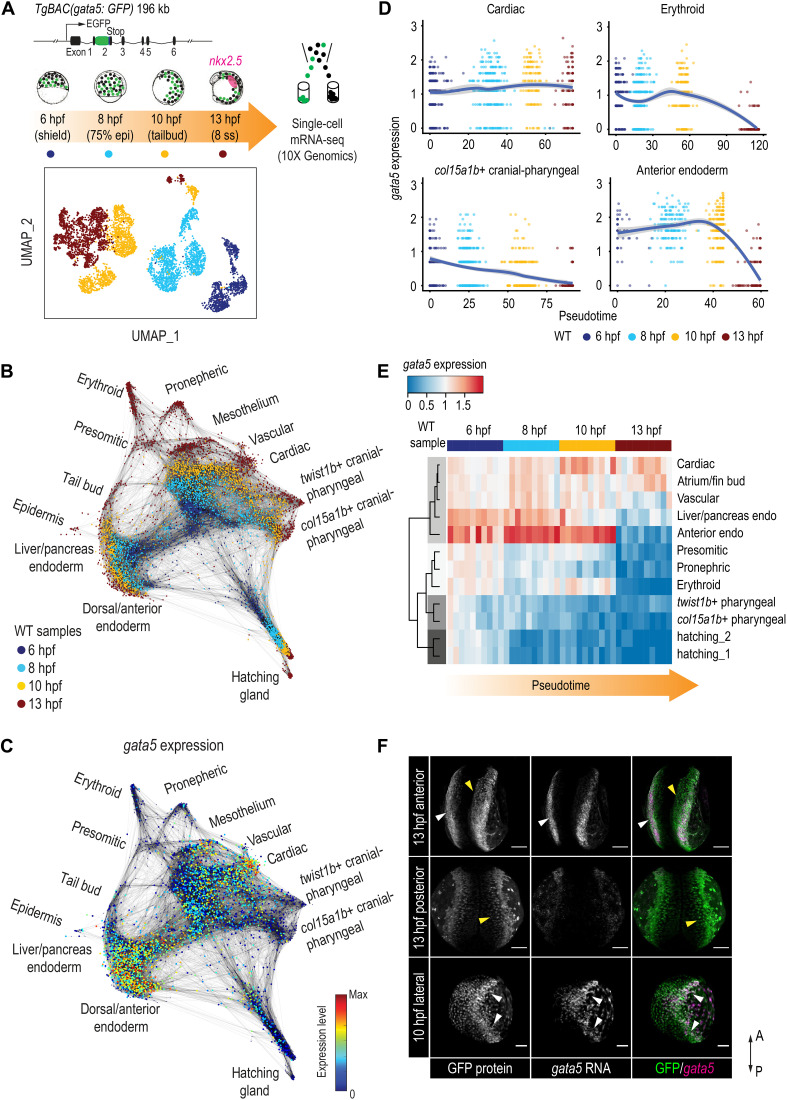
(A) Schematic representation of the scRNA-seq experimental design and UMAP visualization of gata5:GFP+ cells collected at four developmental time points. TgBAC(gata5:GFP) contains a 196-kb genomic region spanning the gata5 locus, with the GFP sequence inserted after the first exon of gata5. (B) Force-directed graph showing the connection between all single cells from the four WT samples. Nodes were colored by developmental time points. Edges link nodes with their neighboring cells. For each cell, up to 20 mutual nearest neighbor edges within or between time points are retained. (C) Expression of gata5 projected on the force-directed graph. (D) Pseudotemporal expression profiles of gata5 along the developmental trajectories of representative lineages (cardiac, pharyngeal_2, erythroid, and anterior endoderm). x axis, pseudotime; y axis, normalized log expression level. The smoothed lines show conditional means after local polynomial regression fitting [LOESS (locally estimated scatterplot smoothing) method] and shaded areas indicate SEs. (E) Heatmap showing gata5 expression along the developmental trajectory of major lineages. Pseudotime was scaled across all lineages for each stage. Each column represents a quantile bin of the scaled pseudotime and each row represents a lineage. gata5 expression mean was calculated for each pseudotime bin for each lineage. The row dendrogram shows the unsupervised hierarchical clustering of each lineage based on gata5 expression dynamics. (F) FISH against gata5 transcripts and immunostaining against GFP at 10 and 13 hpf. White arrowheads show cells positive for both gata5 transcripts and GFP protein; yellow arrowheads indicate cells positive for GFP protein only. A, anterior; P, posterior. Scale bars, 100 μm.