
Fig. 5
Pharyngeal arch specification and patterning defects observed at later developmental stages.
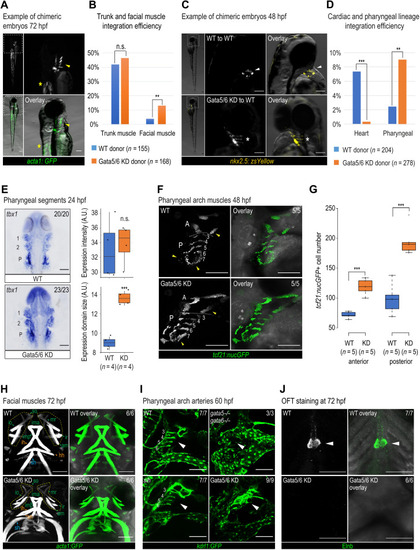
Representative chimeric embryos from transplant experiments using Tg (acta1:GFP)zf13 (A) and Tg (nkx2.5:zsYellow)fb7 (C) donors. (A) Yellow arrowheads, pharyngeal muscle; asterisks, trunk muscle. (C) White arrowheads, cardiomyocytes; asterisks, pharyngeal cells. Quantification of integration efficiency in Tg (acta1:GFP)zf13 (B) and Tg (nkx2.5:zsYellow)fb7 (D) transplant experiments. Fisher’s exact test was used. (E) tbx1 RNA ISH and quantification in WT and Gata5/6 morphants at 24 hpf. 1, pharyngeal arch 1 segment; 2, pharyngeal arch 2 segment; P, posterior pharyngeal arch segment. (F) Confocal images of tcf21+ pharyngeal muscle cells in WT and Gata5/6 morphants at 48 hpf. Yellow arrowheads, expanded anterior and posterior pharyngeal arches upon Gata5/6 loss. A, anterior pharyngeal arches; P, posterior pharyngeal arches, separated by dotted lines. (G) Quantification of tcf21: nucGFP+ cell numbers within the anterior and posterior pharyngeal arches (arches 3 to 7) at 48 hpf. t test was used. (H) Confocal images of acta1:GFP+ facial muscle in WT and Gata5/6 morphants at 72 hpf. Green arrowheads, PA1-derived muscle; orange arrowheads, PA2-derived muscle; blue arrowheads, somite-derived muscle. Yellow boxes, muscle around eyes. am, adductor mandibulae; hh, hyohyal; ih, interhyal; ima, intermandibular anterior; imp, intermandibular posterior; io, inferior oblique; ir, inferior rectus; mr, medial rectus; sh, sternohyoideus; so, superior oblique. (I) Confocal images of kdrl:GFP+ vasculature in control, Gata5/6 morphants, gata5/6 mutants, and sih mutants at 60 hpf. Arrowheads, PAA areas. (J) Confocal images of Elnb antibody staining in WT and Gata5/6 morphants. Arrowheads, OFT smooth muscle cells. ***P < 0.001; **P < 0.01; n.s., P > 0.05. Scale bars, 100 μm. |