
- Title
-
The expression of essential selenoproteins during development requires SECIS-binding protein 2-like
- Authors
- Kiledjian, N.T., Shah, R., Vetick, M.B., Copeland, P.R.
- Source
- Full text @ Life Sci Alliance

Diagram of the zebrafish secisbp2l and sbp2 gene loci (NCBI; note reverse orientation of secisbp2l).
The results of BLAST analysis using the cloned cDNAs for both genes is shown in purple with differences between annotated exons (green) and those derived from cDNA cloning marked by red arrows. The CRISRP/Cas9 target sites in the RNA-binding domains are indicated with arrows. |

Sec-related gene expression during zebrafish development.
Heat map of existing transcriptomic data (White et al, 2017) highlighting selenoprotein and selenoprotein synthetic factor mRNA expression during zebrafish development. Numbers correspond to average transcripts per million from four samples. The color coding is a linear gradient from green to red where the 50th percentile is yellow with the maximum set at 805, which is the maximum for selenoprotein mRNA expression. |
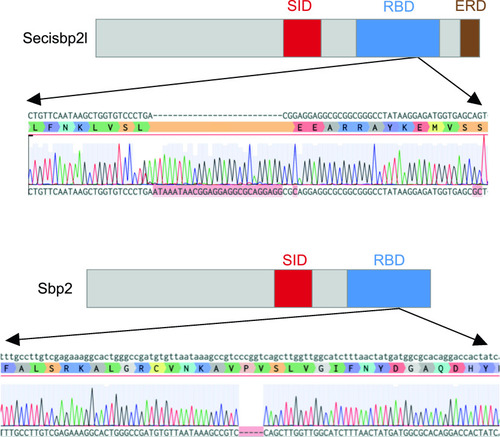
CRISPR/Cas9 mutagenesis of the secisbp2l and sbp2 loci.
Domain diagrams illustrating the relative positions of the Sec incorporation domain (SID), RNA-binding domain (RBD) and the Glu-rich domain (ERD), and sequence analysis of secisbp2l and sbp2 mutations generated by CRISPR/Cas9 illustrating the 26-bp insertion for secisbp2l and the 5 bp deletion in sbp2. |
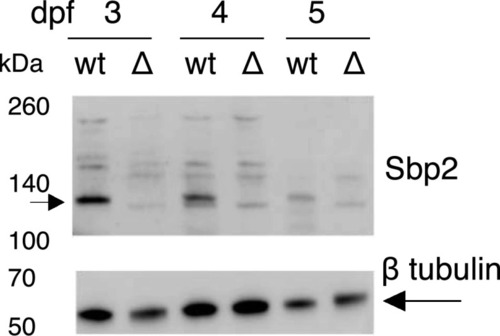
Immunoblot analysis of Sbp2 expression.
Wild-type (wt) and sbp2 −/− (Δ) embryos at the indicated days post fertilization were lysed and two embryo equivalents were loaded onto a 4–12% gradient SDS–PAGE gel. Immunoblot was probed with a polyclonal antibody raised against human SBP2. |
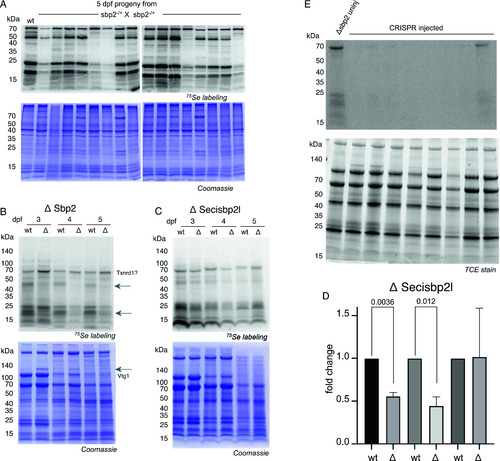
Metabolic labeling reveals selenoprotein synthesis defects.
(A) sbp2 +/− heterozygous fish were mated and offspring were incubated with 375 nM 75Se for 24 h at 4 days post fertilization (dpf). 16 larvae were randomly chosen for SDS–PAGE and phosphorimaging analysis (top panels) and the same gels were stained with Coomassie blue (bottom panels). (A, B) sbp2 −/− and secisbp2l −/− larvae at the developmental stage indicated were labeled and analyzed as described in (A). The 68-kD band that is not affected by the loss of Sbp2 is predicted to be Txnrd1 based on molecular weight. The arrows point out the bands with marked decrease in intensity in the mutated line. The increase in Vtg1 in 3–4 dpf larvae is noted in the Coomassie-stained gel (bottom panel). (B, C) Quantitation of the ΔSecisbp2L gel in (B). Three replicate gels were analyzed and the data are presented as the mean ± SD. Significance was determined with a Welch’s t test with the P-value indicated. (D) sbp2 −/− embryos were injected with single guide RNAs targeting the secisbp2l gene at the single-cell stage. At 3 dpf, larvae were incubated with 375 nM 75Se for 24 h and lysates from individual larvae were analyzed by phosphorimager analysis. Lane 1 is lysate from an uninjected control embryo. The gel contained trihalo compounds and total protein was imaged under UV light (lower panel). Source data are available for this figure. |
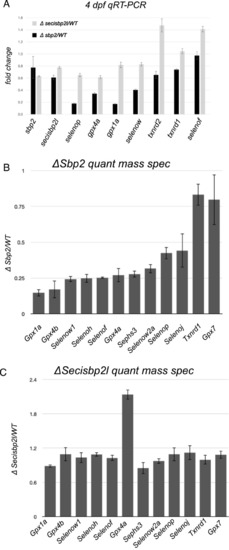
Quantitative analysis of selenoprotein mRNA and protein levels in sbp2 −/− and secisbp2l −/− larvae.
(A) Total RNA was extracted from 4 days post fertilization larvae and was analyzed by qRT-PCR using primers specific for the genes noted. The data shown are the average ΔΔCT ratios from triplicate analyses using eef1a as the control plus/minus SD. (B) Total protein lysates from wild-type and sbp2 −/− larvae were subjected to quantitative mass spectrometry. The data shown represent the average mutant/wt peptide count ratio from four replicate samples, plus/minus SD. (C) Same as in (B) for the secisbp2l −/− samples. |
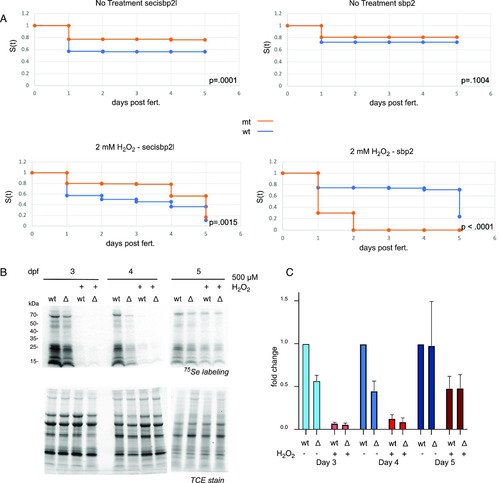
Mutant sbp2 −/− larvae and general selenoprotein production are sensitive to peroxide treatment.
(A) Wild-type (blue) or mutant (orange) larvae (n = 110) were raised in embryo medium with or without 2 mM hydrogen peroxide for 5 d (water was changed daily). Survival was analyzed by the Kaplan-Meier method and P-values were determined by the log-rank test. (B) 3–5 days post fertilization wild-type (wt) or secisbp2l−/− (Δ) larvae were incubated with 375 nM 75Se with or without 500 μM hydrogen peroxide for 24 h. Radiolabeled proteins were analyzed by SDS–PAGE followed by phosphorimaging (top panels) and total protein is shown as fluorescence imaging of TCE-stained gels (bottom panel). (C) Quantitative analysis of selenoprotein production in the presence or absence of peroxide. (B) 75Se incorporation was determined by quantitation of the phosphorimages shown in (B). Data were normalized to wild-type untreated samples and shown as the average of three experiments plus/minus SD. |