
Image
|
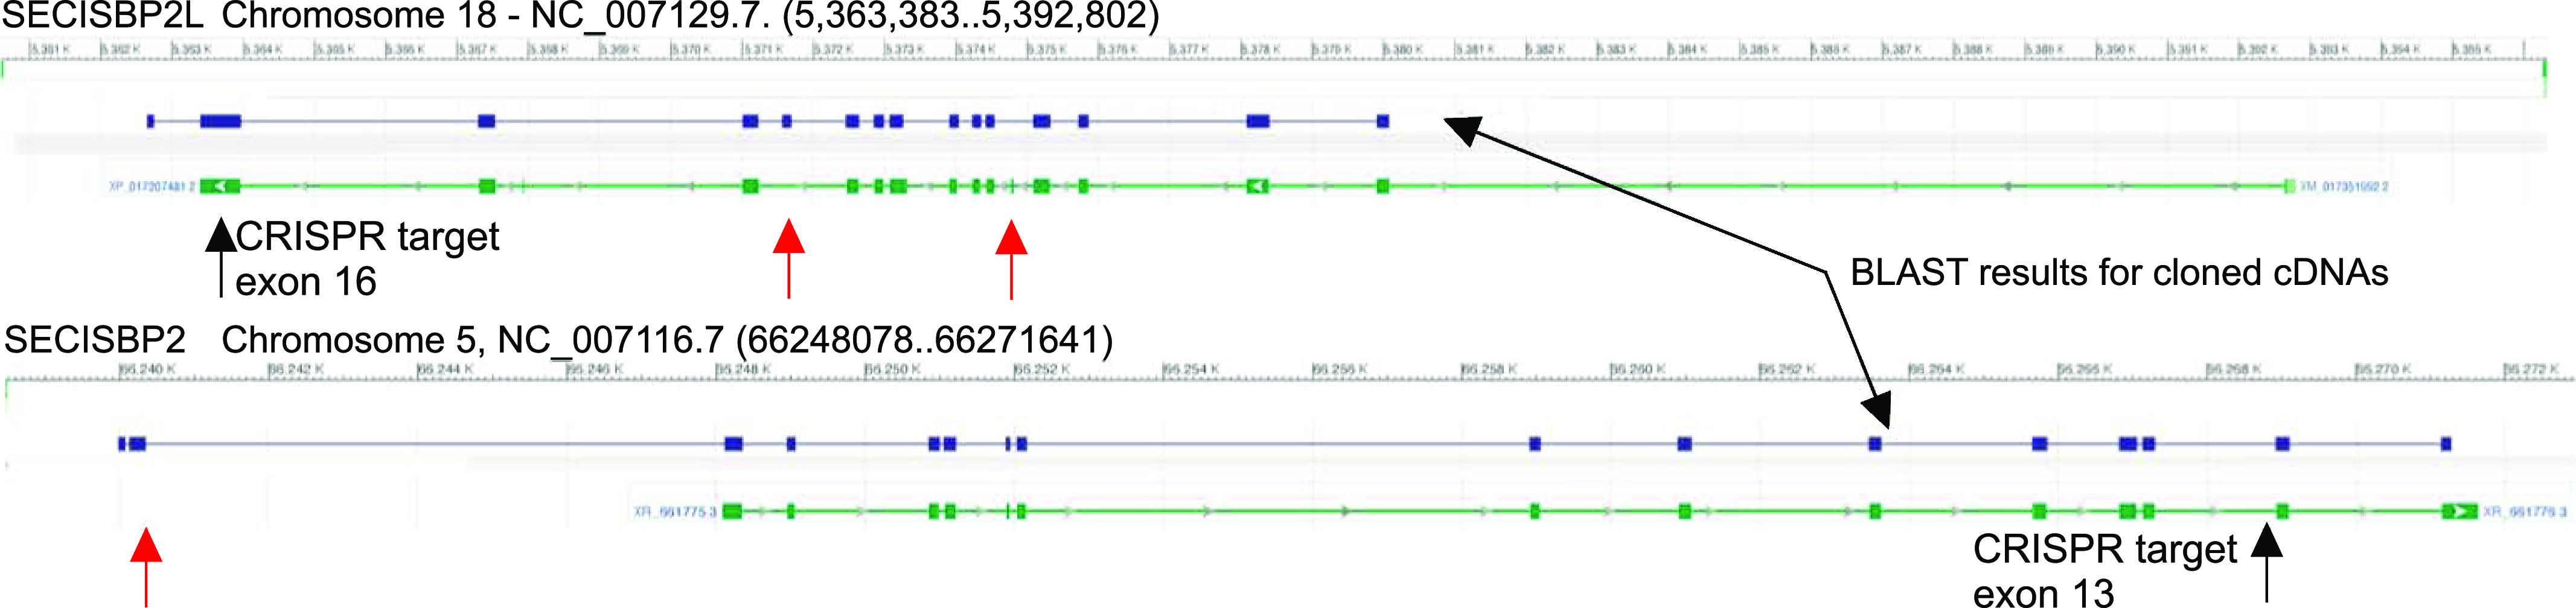
Figure Caption
Figure 1.
Diagram of the zebrafish secisbp2l and sbp2 gene loci (NCBI; note reverse orientation of secisbp2l).
The results of BLAST analysis using the cloned cDNAs for both genes is shown in purple with differences between annotated exons (green) and those derived from cDNA cloning marked by red arrows. The CRISRP/Cas9 target sites in the RNA-binding domains are indicated with arrows.
Acknowledgments
This image is the copyrighted work of the attributed author or publisher, and
ZFIN has permission only to display this image to its users.
Additional permissions should be obtained from the applicable author or publisher of the image.
Full text @ Life Sci Alliance