
Image
|
Figure Caption
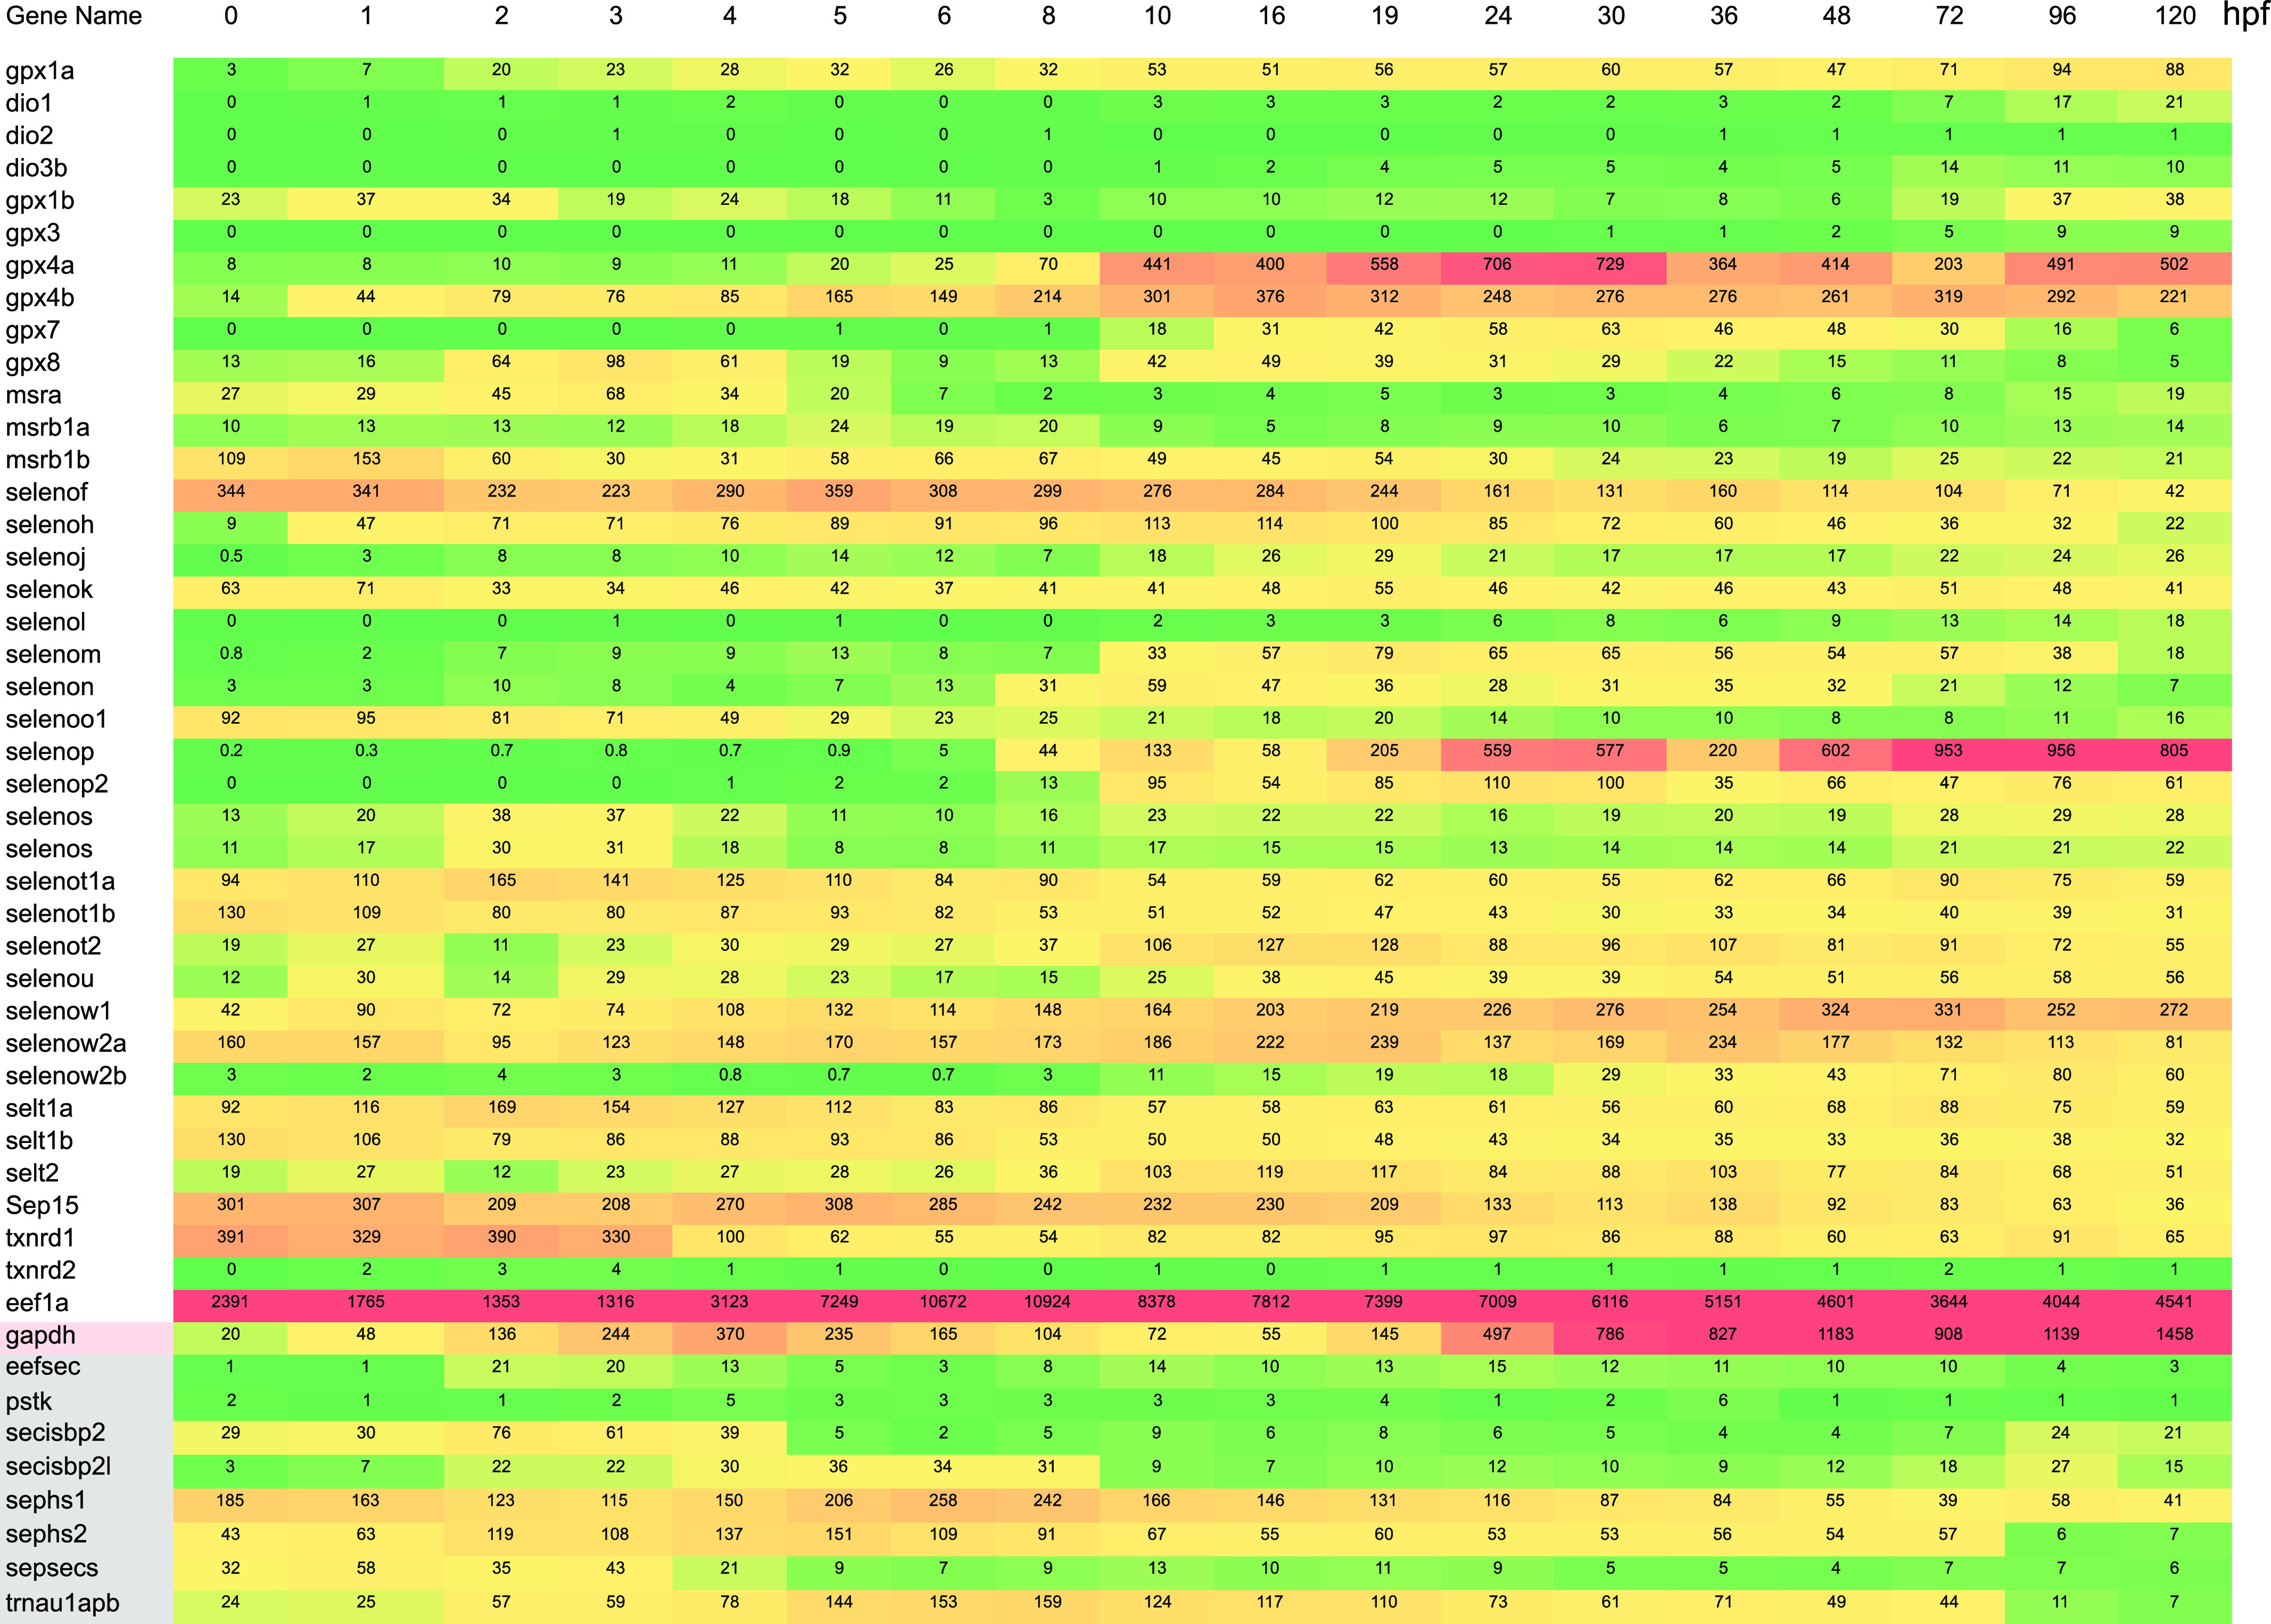
Figure 2.
Sec-related gene expression during zebrafish development.
Heat map of existing transcriptomic data (White et al, 2017) highlighting selenoprotein and selenoprotein synthetic factor mRNA expression during zebrafish development. Numbers correspond to average transcripts per million from four samples. The color coding is a linear gradient from green to red where the 50th percentile is yellow with the maximum set at 805, which is the maximum for selenoprotein mRNA expression.
Acknowledgments
This image is the copyrighted work of the attributed author or publisher, and
ZFIN has permission only to display this image to its users.
Additional permissions should be obtained from the applicable author or publisher of the image.
Full text @ Life Sci Alliance