
|
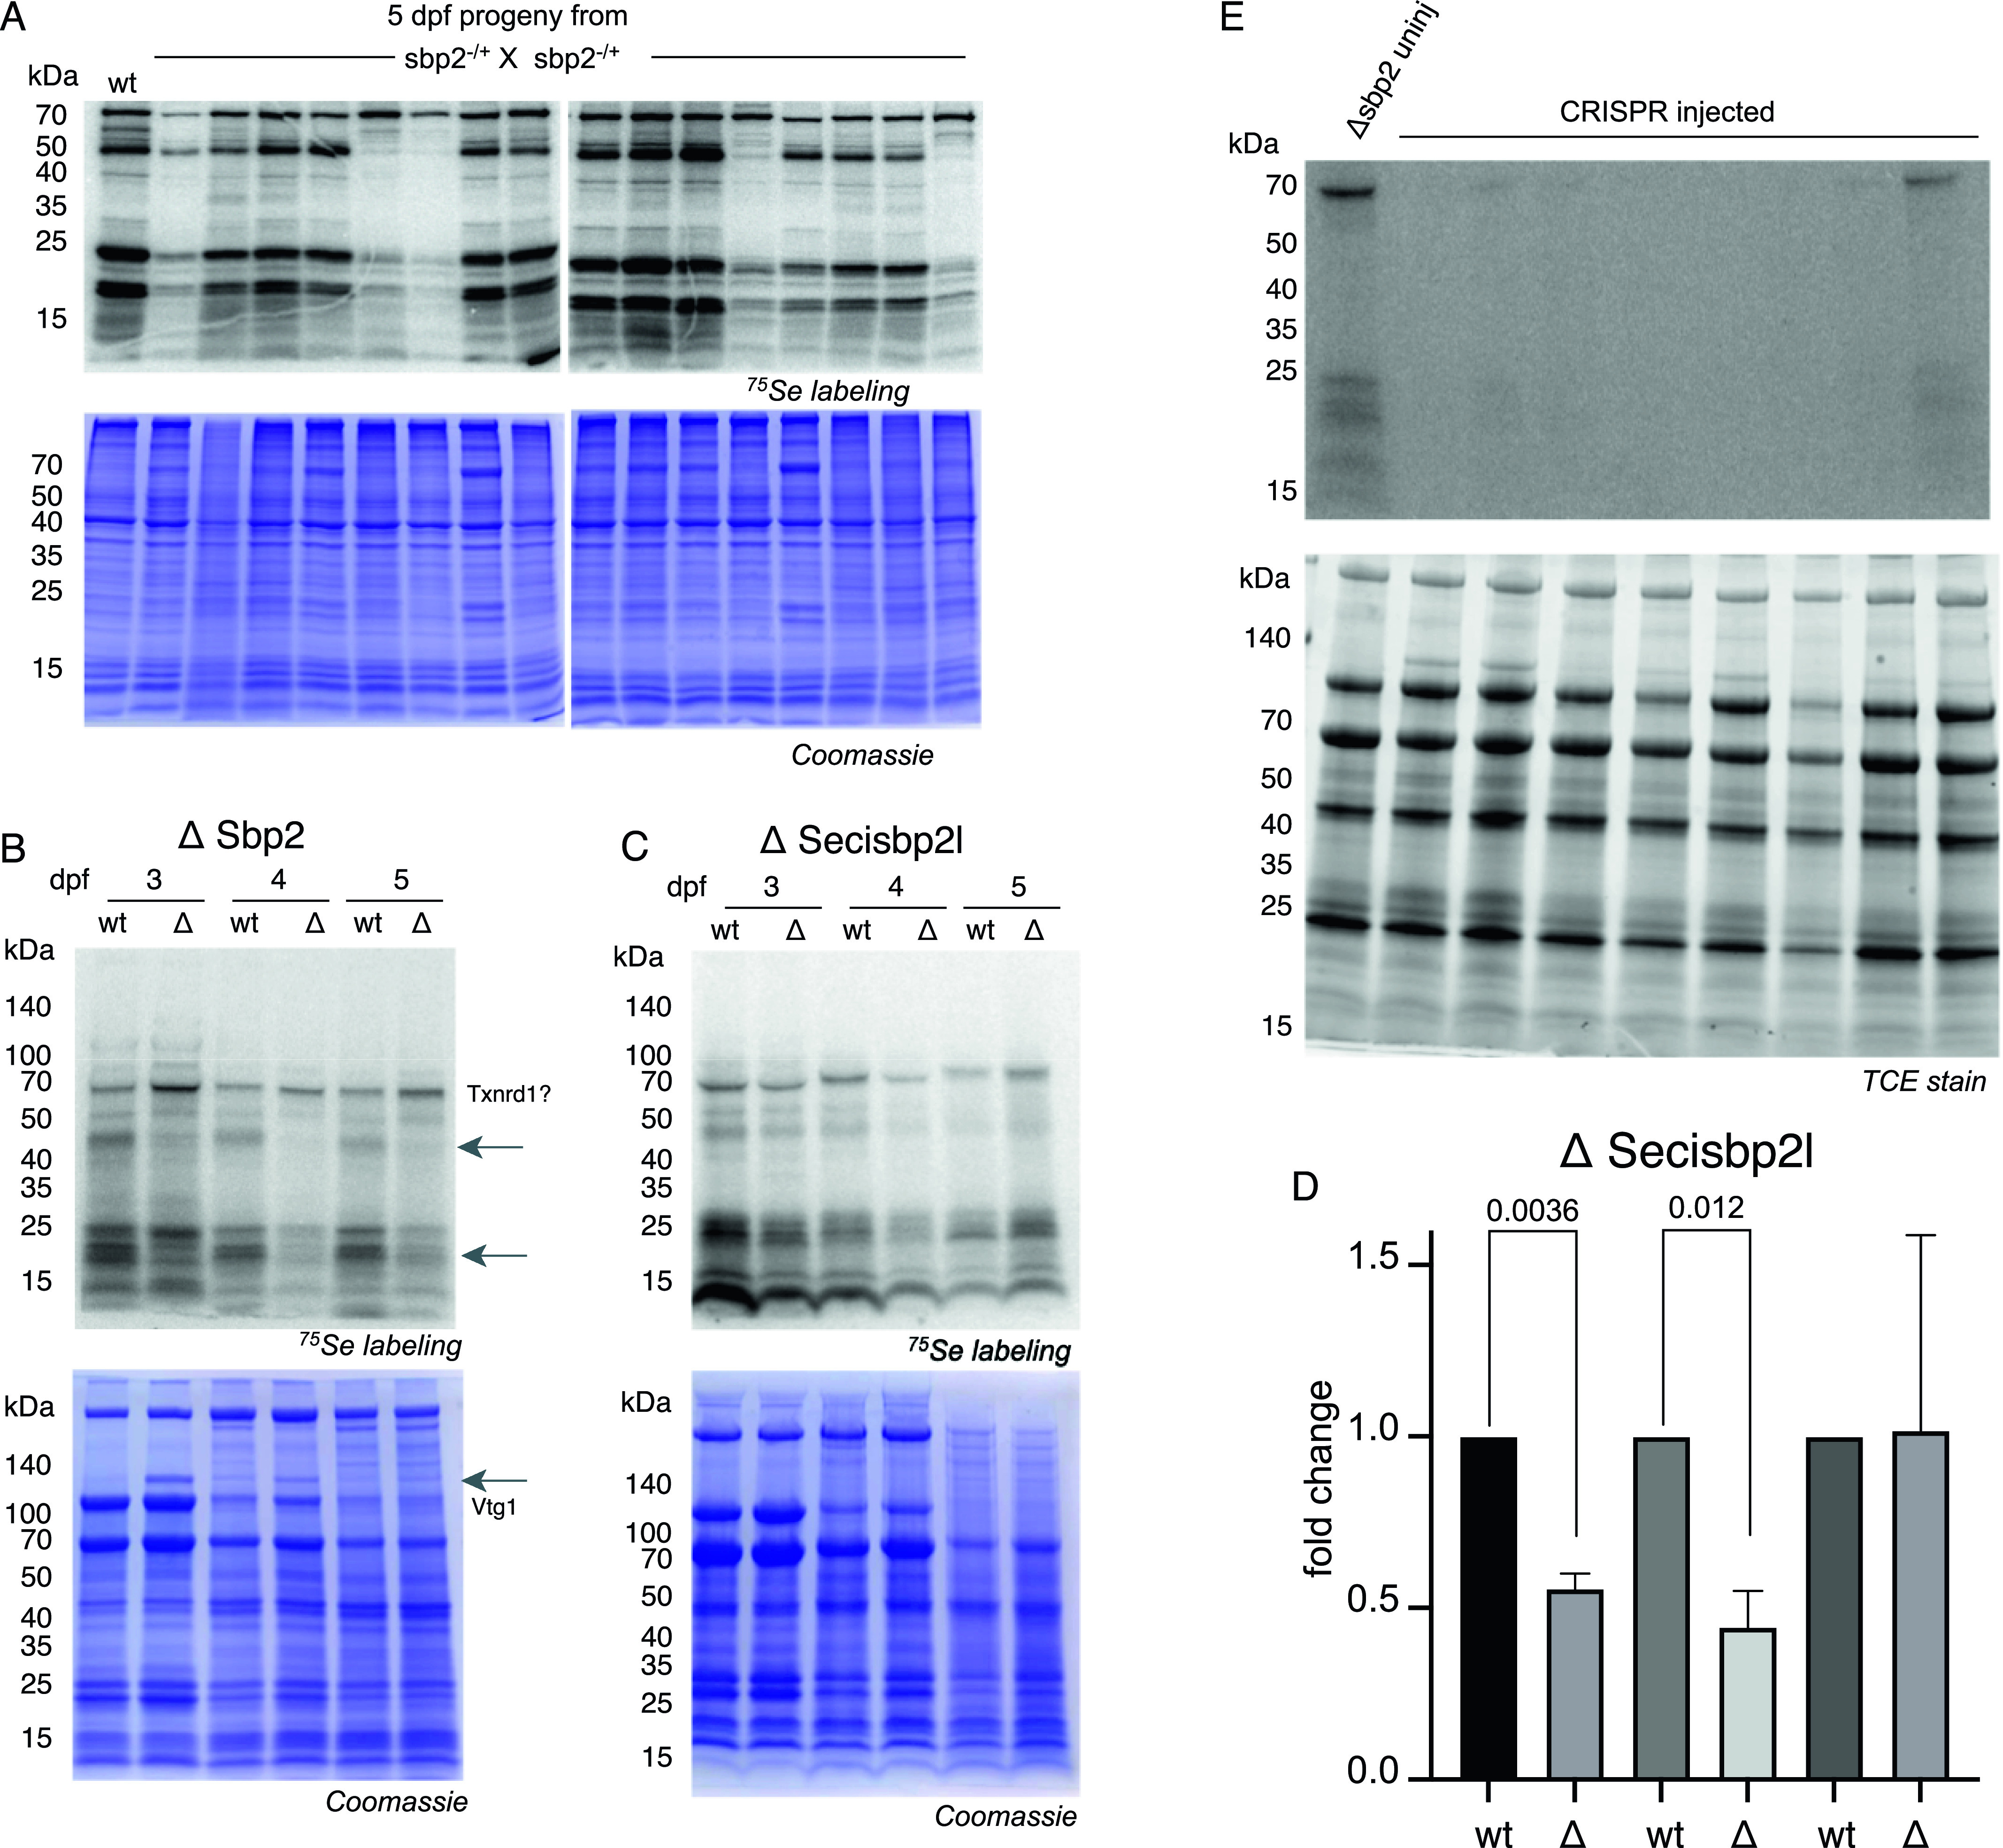
Figure 5.
(A) sbp2 +/− heterozygous fish were mated and offspring were incubated with 375 nM 75Se for 24 h at 4 days post fertilization (dpf). 16 larvae were randomly chosen for SDS–PAGE and phosphorimaging analysis (top panels) and the same gels were stained with Coomassie blue (bottom panels). (A, B) sbp2 −/− and secisbp2l −/− larvae at the developmental stage indicated were labeled and analyzed as described in (A). The 68-kD band that is not affected by the loss of Sbp2 is predicted to be Txnrd1 based on molecular weight. The arrows point out the bands with marked decrease in intensity in the mutated line. The increase in Vtg1 in 3–4 dpf larvae is noted in the Coomassie-stained gel (bottom panel). (B, C) Quantitation of the ΔSecisbp2L gel in (B). Three replicate gels were analyzed and the data are presented as the mean ± SD. Significance was determined with a Welch’s t test with the P-value indicated. (D) sbp2 −/− embryos were injected with single guide RNAs targeting the secisbp2l gene at the single-cell stage. At 3 dpf, larvae were incubated with 375 nM 75Se for 24 h and lysates from individual larvae were analyzed by phosphorimager analysis. Lane 1 is lysate from an uninjected control embryo. The gel contained trihalo compounds and total protein was imaged under UV light (lower panel).
Source data are available for this figure.