
- Title
-
A novel chemo-phenotypic method identifies mixtures of salpn, vitamin D3, and pesticides involved in the development of colorectal and pancreatic cancer
- Authors
- Issa, N.T., Wathieu, H., Glasgow, E., Peran, I., Parasido, E., Li, T., Simbulan-Rosenthal, C.M., Rosenthal, D., Medvedev, A.V., Makarov, S.S., Albanese, C., Byers, S.W., Dakshanamurthy, S.
- Source
- Full text @ Ecotoxicol. Environ. Saf.

Fig. 1. Schematic of the chemo-phenotypic toxicity measurement (CPTM) for the generation of toxicity scores (Zts). An environmental chemical (EC) is given a toxicity score based on the combination of biological, chemical, and toxico-kinetic terms (see Section 14). Tox-TMFS is used to predict novel EC-protein target associations in addition to experimentally determined associations obtained from the Comparative Toxicogenomics Database (CTD). The chemical promiscuity score is the total number of unique known and predicted targets. ECs are then associated with higher-order biological effects through those targets, which include protein-protein interactions, pathways, and functions. The number of these elements contributes to an EC’s biological perturbation score. The toxicokinetic (TK) score is determined by the total number of potential reactions that an EC can undergo into metabolites and the predicted percent human oral absorption. The chemical reactivity index is composed of physico-toxico chemical properties associated with general mechanisms of toxicity, which include: log P, electrophilic Fukui index (f-), HOMO-LUMO energy band gap, electron affinity, ionization potential, chemical hardness, chemical potential, and electrophilicity index. The individual score terms are combined to give a comprehensive toxicity score (Zts) to rank ECs, where higher scores denote greater toxicity. |
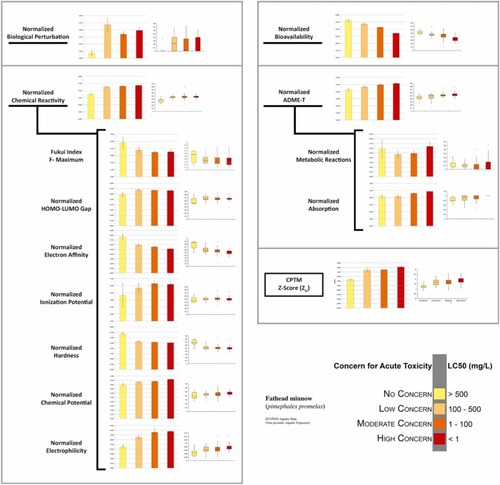
Fig. 2. Graphical representation of CPTM-computed EC biological and chemical parameters for each level of toxic concern category derived from ECOTOX fathead minnow (Pimephales promelas) LC50 animal aquatic toxicity data. Also, graphically depicted are the CPTM parameters, as they vary depending on the level of toxic concern of our assessed ECs. Brackets demonstrate the parameters included in the calculation of chemical reactivity and ADME-T toxic indices (see Section 14 for description). The other two indices, those of biological perturbation and bioavailability, are represented as single parameters. Left columns are bar graphs displaying mean values with error bars representing one standard error from the mean. Right columns are box plots reflecting the distribution of values in each category. |
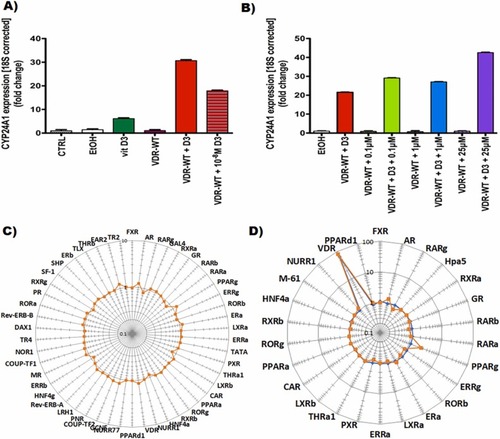
Fig. 3. (A) and (B) Treatment with vitamin D3 in combination with salpn super-activates VDR signaling in HEK293T cells. CYP24A1 is induced upon activation of VDR signaling, and its expression was assessed in cells with native VDR or cells transfected with wild type VDR (VDR-WT). Upon transfection, HEK293T cells were treated for 24 h with vitamin D3 with or without salpn at various concentrations. Vitamin D3 at 10−7 M was used unless stated otherwise. 40x diluted 100% ethanol (EtOH) in cell growth media was used as vehicle control. The bars represent the mean value of triplicate treatments, and error bars represent standard error of the mean. (A) Treatment with 10−7 M of vitamin D3 induces CYP24A1 expression even further when cells are transfected with VDR-WT. Additionally, 10−8 M of vitamin D3 increases CYP24A1 expression, showing a dose-dependent effect. Control (CTRL) and vehicle (EtOH) treated or VDR-WT transfected cells did not increase CYP24A1 expression in the absence of vitamin D3. (B) Salpn induces CYP24A1 expression in a dose-dependent manner when vitamin D3 is present, showing an additive effect over vitamin D3 effect by itself. (C) Effect of salpn alone (orange) at 10 µM, 16 h, (D) vitamin D3 alone (blue), and (D) salpn + Vitamin D3 mixture (orange) on nuclear receptor activity in HepG2 cells. HepG2 cells were transiently transfected with optimized trans-FACTORIALTM library. Twenty-four hours after transfection cells were washed and supplied with fresh low serum (1% FBS, charcoal stripped) culture medium and treated with inducer for 16 h. Profile of the trans-FACTORIALTM activities was determined as fold of induction values versus vehicle-treated (DMSO) control cells. Graph shows fold-induction data plotted in logarithmic scale. |
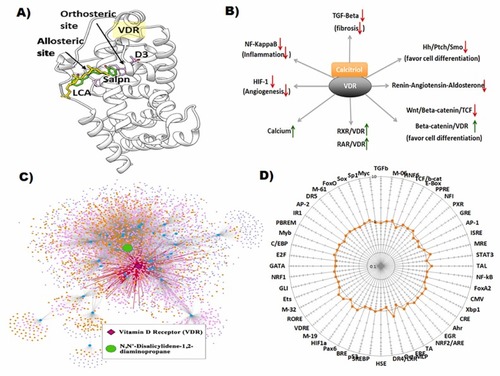
Fig. 4. (A) Vitamin D3 receptor, VDR (white ribbon) with D3 (magenta) docked at its orthosteric site and salpn (green) docked at the LCA (yellow) allosteric binding site. (B) Downstream effects of VDR activation by its cognate ligand calcitriol (activated Vitamin D3). Arrows denote directionality of biological response. (C) Entire Cellular Network Model for salpn with highlighted VDR subnetwork. The green node is salpn, blue nodes are direct protein interactions, light pink nodes are PPIs, orange nodes are pathways, and purple nodes are molecular functions. Dark pink node is the direct interacting protein VDR, with protruding edges in red to signify direct perturbation network of VDR. This network excludes disease associations from the OMIM database, instead describing all possible disease-associated biological activity perturbed from an EC-centric viewpoint. (D) Effect of salpn (10 µM, 16 h) on transcription factor activity in HepG2 cells. HepG2 cells were transiently transfected with optimized cis-FACTORIALTM library. Twenty-four hours after transfection cells were washed and supplied with fresh low serum (1% FBS, charcoal stripped) culture medium and treated with inducer for 16 h. Profile of the cis-FACTORIALTM activities was determined as fold of induction values versus vehicle-treated (DMSO) control cells. Graph shows fold-induction data plotted in logarithmic scale. Insert table is a list of transcriptional pathways tested for their activity. |
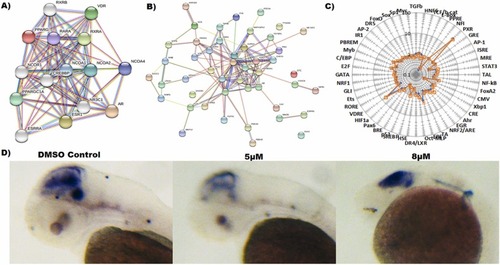
Fig. 5. (A) Protein-protein STRING Interaction map of nuclear receptors cross-talk with each other including VDR directly or indirectly (B). (C) Effect of salpn (10 µM, 16 h) in combination with D3 (orange) or D3 alone (blue) on transcription factor activity in HepG2 cells. HepG2 cells were transiently transfected with the optimized cis-FACTORIALTM library. Twenty-four hours after transfection cells were washed and supplied with fresh low serum (1% FBS, charcoal stripped) culture medium and treated with inducer for 16 h. Profile of the cis-FACTORIALTM activities was determined as fold of induction values versus vehicle-treated (DMSO) control cells. The graph shows fold-induction data plotted on a logarithmic scale. Insert table is a list of transcriptional pathways tested for their activity. (G) Wnt signaling modulation of salpn in zebrafish. (E) Wnt reporter activity was visualized in zebrafish using whole-mount in situ hybridization (WISH) for GFP expression. |
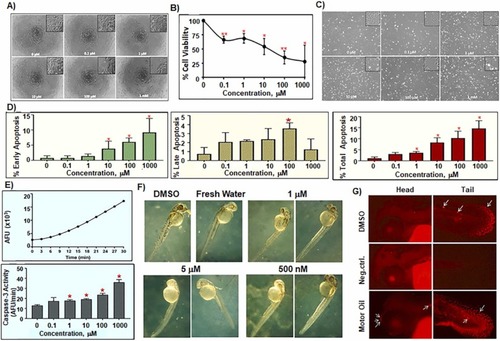
Fig. 6. XTT assay of HaCaT Cells treated with increasing concentrations of salpn for 72 h (A & B). (A) Representative images of HaCaT human skin keratinocytes incubated with indicated concentrations of salpn for 72 h in 96-well plates. (B) Dose-response for HaCaT skin keratinocytes cells after treatment with salpn showing a marked decrease in cell viability after exposure to salpn. The IC50 (C) for salpn is 84 µM. Annexin/PI Apoptotic Assay of HaCaT cells treated by salpn for 72 h (C & D). (C) Representative images of HaCaT human skin keratinocytes in 6-well plates showing effects of exposure to increasing concentrations of salpn for 72 h. (D) Annexin-PI staining apoptosis data after treatment with salpn showing % of live cells, early, late and total apoptosis, respectively. Caspase-3 Activity Assay of HaCaT Cells treated with increasing concentrations of salpn for 72 h (E). Induction of caspase-3 activity in Jurkat positive control cells exposed to etoposide (upper panel) and cells treated with different concentrations of salpn (lower panel). Zebrafish morphological assay (F). Dose-dependent response toxicity of salpn measured as the lowest dose leading to significant developmental abnormalities at 2 days after post fertilization (2 dpf). TUNEL TMR apoptosis assay (G) with salpn treated embryos, dark dim background staining has either no staining (Negative control) or very few apoptotic cells (DMSO control). Arrows on the picture show the positive cells. Apoptotic cells in 2 dpf embryos were labeled using the in-situ Cell Death Detection Kit-TMR. PHENOTYPE:
|
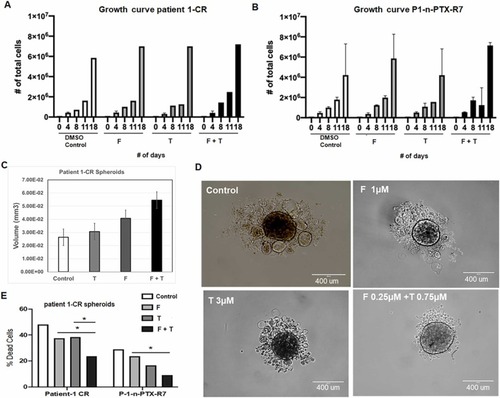
Fig. 7. (A) Patient-1-derived (Patient-1-CR) cells and (B) n-PTX-resistant (P1-n-PTX-R7) cells were continuously exposed to fenpropathrin (F) and tetramethrin (T). To evaluate the effect of F and T on growth rate, 10,000 cells were seeded for each condition. Cells were counted at 4, 8, 11, and 18 days. The chemicals are treated at the following concentrations with F (1 µM); T (3 µM) and the mixture F (0.25 µM) + T (0.75 µM). (C) and (D) Patient-1-CR cells, continuously exposed to F and T were used to evaluate the spheroid formation. 4000 cells per condition were seeded in a low adherent 96 well plate. F and T were added alone or in combination to 3D media. Spheroids volume was measured at day 4 using ImageJ and ellipsoid formula. (D) Representative images of the spheroids shown with control, treated F, T, and F + T. The spheroids were originated seeding 1000 cells in a U shape low adherent plate, using 3D-conditioned media, as per protocol, with a volume of 50 μL. Every 2 days, the medium was replaced with fresh medium containing fresh T, F or T + F. Final measurements were taken after 13 days. (E) Patient-1-CR cells and P1-n-PTX-R7 cells were continuously exposed to F and T for over a month. To evaluate the effect of F and T exposure on n-PTX resistance, cells were exposed to 1 μM of n-PTX. After 72 h, trypan blue exclusion assay was used to evaluate the % of dead cells. |