
Fig. 2
- ID
- ZDB-FIG-220822-51
- Publication
- Issa et al., 2022 - A novel chemo-phenotypic method identifies mixtures of salpn, vitamin D3, and pesticides involved in the development of colorectal and pancreatic cancer
- Other Figures
- All Figure Page
- Back to All Figure Page
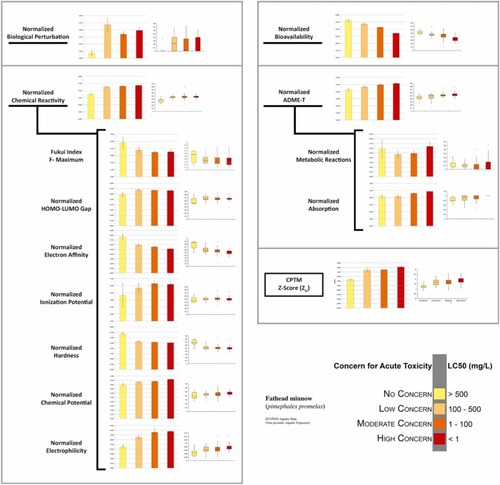
Fig. 2. Graphical representation of CPTM-computed EC biological and chemical parameters for each level of toxic concern category derived from ECOTOX fathead minnow (Pimephales promelas) LC50 animal aquatic toxicity data. Also, graphically depicted are the CPTM parameters, as they vary depending on the level of toxic concern of our assessed ECs. Brackets demonstrate the parameters included in the calculation of chemical reactivity and ADME-T toxic indices (see Section 14 for description). The other two indices, those of biological perturbation and bioavailability, are represented as single parameters. Left columns are bar graphs displaying mean values with error bars representing one standard error from the mean. Right columns are box plots reflecting the distribution of values in each category. |