
|
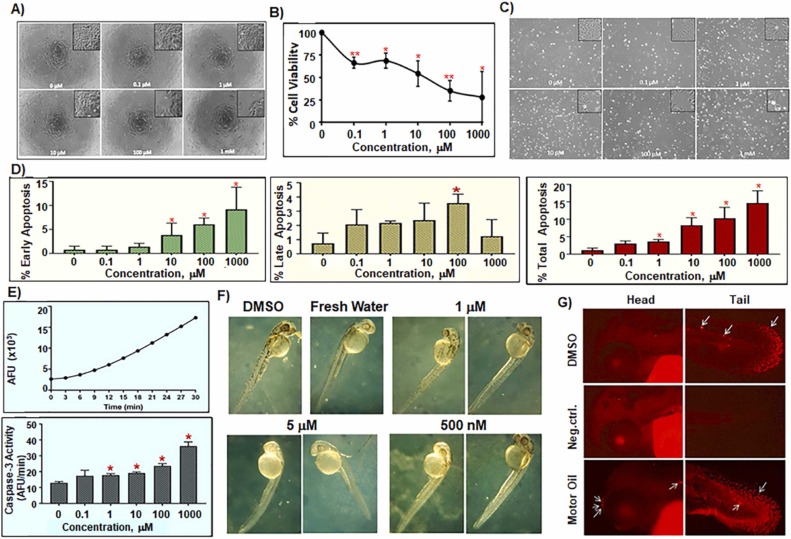
Fig. 6 Fig. 6. XTT assay of HaCaT Cells treated with increasing concentrations of salpn for 72 h (A & B). (A) Representative images of HaCaT human skin keratinocytes incubated with indicated concentrations of salpn for 72 h in 96-well plates. (B) Dose-response for HaCaT skin keratinocytes cells after treatment with salpn showing a marked decrease in cell viability after exposure to salpn. The IC50 (C) for salpn is 84 µM. Annexin/PI Apoptotic Assay of HaCaT cells treated by salpn for 72 h (C & D). (C) Representative images of HaCaT human skin keratinocytes in 6-well plates showing effects of exposure to increasing concentrations of salpn for 72 h. (D) Annexin-PI staining apoptosis data after treatment with salpn showing % of live cells, early, late and total apoptosis, respectively. Caspase-3 Activity Assay of HaCaT Cells treated with increasing concentrations of salpn for 72 h (E). Induction of caspase-3 activity in Jurkat positive control cells exposed to etoposide (upper panel) and cells treated with different concentrations of salpn (lower panel). Zebrafish morphological assay (F). Dose-dependent response toxicity of salpn measured as the lowest dose leading to significant developmental abnormalities at 2 days after post fertilization (2 dpf). TUNEL TMR apoptosis assay (G) with salpn treated embryos, dark dim background staining has either no staining (Negative control) or very few apoptotic cells (DMSO control). Arrows on the picture show the positive cells. Apoptotic cells in 2 dpf embryos were labeled using the in-situ Cell Death Detection Kit-TMR.