
Fig. 7
- ID
- ZDB-FIG-220822-56
- Publication
- Issa et al., 2022 - A novel chemo-phenotypic method identifies mixtures of salpn, vitamin D3, and pesticides involved in the development of colorectal and pancreatic cancer
- Other Figures
- All Figure Page
- Back to All Figure Page
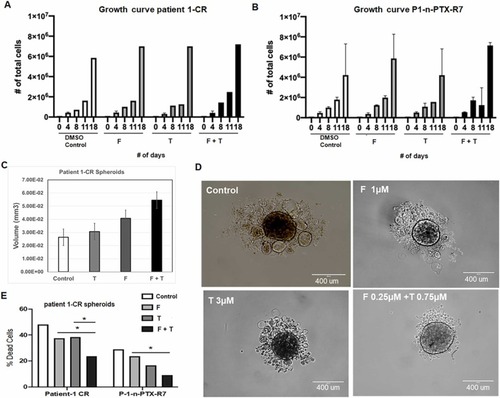
Fig. 7. (A) Patient-1-derived (Patient-1-CR) cells and (B) n-PTX-resistant (P1-n-PTX-R7) cells were continuously exposed to fenpropathrin (F) and tetramethrin (T). To evaluate the effect of F and T on growth rate, 10,000 cells were seeded for each condition. Cells were counted at 4, 8, 11, and 18 days. The chemicals are treated at the following concentrations with F (1 µM); T (3 µM) and the mixture F (0.25 µM) + T (0.75 µM). (C) and (D) Patient-1-CR cells, continuously exposed to F and T were used to evaluate the spheroid formation. 4000 cells per condition were seeded in a low adherent 96 well plate. F and T were added alone or in combination to 3D media. Spheroids volume was measured at day 4 using ImageJ and ellipsoid formula. (D) Representative images of the spheroids shown with control, treated F, T, and F + T. The spheroids were originated seeding 1000 cells in a U shape low adherent plate, using 3D-conditioned media, as per protocol, with a volume of 50 μL. Every 2 days, the medium was replaced with fresh medium containing fresh T, F or T + F. Final measurements were taken after 13 days. (E) Patient-1-CR cells and P1-n-PTX-R7 cells were continuously exposed to F and T for over a month. To evaluate the effect of F and T exposure on n-PTX resistance, cells were exposed to 1 μM of n-PTX. After 72 h, trypan blue exclusion assay was used to evaluate the % of dead cells. |