
|
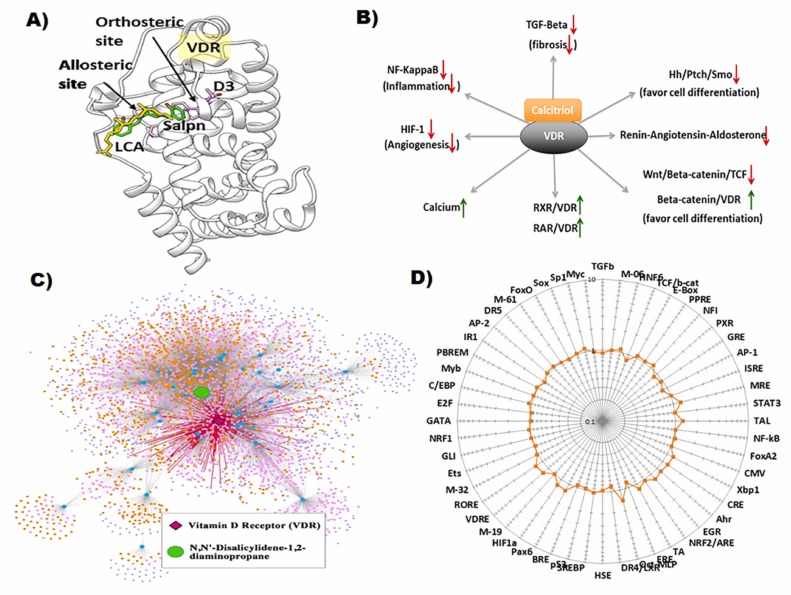
Fig. 4 Fig. 4. (A) Vitamin D3 receptor, VDR (white ribbon) with D3 (magenta) docked at its orthosteric site and salpn (green) docked at the LCA (yellow) allosteric binding site. (B) Downstream effects of VDR activation by its cognate ligand calcitriol (activated Vitamin D3). Arrows denote directionality of biological response. (C) Entire Cellular Network Model for salpn with highlighted VDR subnetwork. The green node is salpn, blue nodes are direct protein interactions, light pink nodes are PPIs, orange nodes are pathways, and purple nodes are molecular functions. Dark pink node is the direct interacting protein VDR, with protruding edges in red to signify direct perturbation network of VDR. This network excludes disease associations from the OMIM database, instead describing all possible disease-associated biological activity perturbed from an EC-centric viewpoint. (D) Effect of salpn (10 µM, 16 h) on transcription factor activity in HepG2 cells. HepG2 cells were transiently transfected with optimized cis-FACTORIALTM library. Twenty-four hours after transfection cells were washed and supplied with fresh low serum (1% FBS, charcoal stripped) culture medium and treated with inducer for 16 h. Profile of the cis-FACTORIALTM activities was determined as fold of induction values versus vehicle-treated (DMSO) control cells. Graph shows fold-induction data plotted in logarithmic scale. Insert table is a list of transcriptional pathways tested for their activity.