
- Title
-
PHLPP1 promotes neutral lipid accumulation through AMPK/ChREBP-dependent lipid uptake and fatty acid synthesis pathways
- Authors
- Balamurugan, K., Medishetti, R., Kotha, J., Behera, P., Chandra, K., Mavuduru, V.A., Joshi, M.B., Samineni, R., Katika, M.R., Ball, W.B., Thondamal, M., Challa, A., Chatti, K., Parsa, K.V.L.
- Source
- Full text @ iScience

ChREBP-mediated PHLPP1 regulation in in vitro foam cells (A–C) Dose and time kinetics of PHLPP1 protein levels (A) with densitometric quantification (bottom) and mRNA (B and C) levels after OxLDL treatment in RAW 264.7 cells; Statistical analysis was performed using one-way ANOVA followed by Bonferroni multiple comparisons test for (C) (∗p < 0.05 vs Control, 0 h; ap < 0.05 vs 24 h). (D) Protein levels of PHLPP1, ChREBP, and ER stress markers upon 7-ketocholesterol treatment under different time points. Densitometric analysis is shown in Figure S1C. (E) PHLPP1 protein levels upon 48 h OxLDL and 7-ketocholesterol treatment along with densitometric quantification (Bottom). (F and G) PHLPP1 protein (F) and mRNA (G) levels upon ChREBP overexpression; Statistical analysis was performed using two-tailed t-test for (G) (∗p < 0.05 vs Vector). (H) PHLPP1 and FASN protein levels in ChREBP knockdown cells treated with 7-kC or OxLDL. Densitometric analysis is shown in Figure S1D. (I) Recruitment of ChREBP to PHLPP1 promoter. Data are a representative of three independent experiments. Numerical data are expressed as mean ± SEM. See also Figures S1 and S2. |
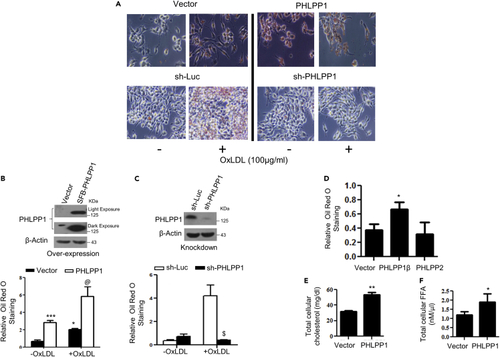
PHLPP1 promotes foam cells in vitro (A–C) Neutral lipid staining by Oil Red O (A) along with quantification in PHLPP1 overexpressing (A and B) or knockdown RAW 264.7 cells (A and C) with parallel immunoblot analysis (B and C top panels); Images are taken at |×20×| magnification. Each image in (A) is a representative image of four different experiments with a minimum of eight different fields in each experiment. Statistical analysis was performed using one-way ANOVA followed by Bonferroni′s post hoc test (∗p < 0.05, ∗∗∗p < 0.001 vs Vector-OxLDL; @p < 0.05 vs PHLPP1-OxLDL; $p < 0.05 vs sh-Luc+OxLDL). (D) Neutral lipid staining in cells overexpressing PHLPP isoforms; Statistical analysis was performed using one-way ANOVA followed by Dunnett′s multiple comparisons test (∗p < 0.05 vs Vector). (E and F) Total cellular cholesterol (E) and FFA levels (F) in RAW 264.7 cells upon PHLPP1 overexpression; Statistical analysis was performed using two-tailed t-test (∗p < 0.05, ∗∗p < 0.01 vs Vector). Data are a representative of at least three independent experiments. Numerical data are expressed as mean ± SEM. |

RNA-seq analysis of PHLPP1 depleted in vitro foam cells (A) Representation of experimental conditions-set 1: control cells versus OxLDL-treated control cells; set 2: control cells versus PHLPP1-knockdown cells; set 3: OxLDL-treated control cells versus OxLDL-treated PHLPP1-knockdown cells. (B) Volcano plot analysis of set 1, 2 and 3 genes. (C) Venn diagram showing commonly affected genes in the three sets. (D) Top 25 affected pathways in set 3 were identified using Enrichr tool by submitting the differentially altered genes from set 3 (fold change >1.5, FDR: 0.05). KEGG 2021 human pathways library was used to analyze the possible disease conditions. (E) Heatmap analysis of selected pathways (inflammation, cholesterol biosynthesis, and lipid metabolism) of set 3. Data are a representative of three independent experiments. See also Figure S3. |
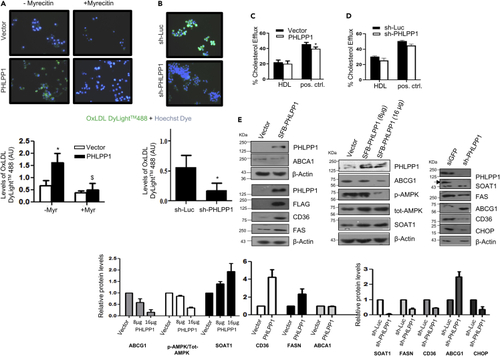
PHLPP1 deficiency suppresses lipid metabolism gene expression (A and B) Fluorescent images of DyLight™488 OxLDL-treated Hoechst-stained PHLPP1 overexpressing (A) or knockdown (B) RAW 264.7 cells along with quantification (bottom); Each image in (A and B) is a representative image of three different experiments with a minimum of 10 different fields in each experiment. Images are taken at |×20×| magnification; Statistical analysis in (A) was performed using one-way ANOVA followed by Bonferroni′s post hoc test (∗p < 0.05, vs Vector-Myr; $p < 0.05 vs PHLPP-Myr); Statistical analysis in (B) was performed using two-tailed t-test (∗p < 0.05, vs sh-Luc). (C and D) BODIPY-labeled cholesterol efflux quantification in PHLPP1 overexpressing (C) or knockdown cells (D); statistical analysis was performed using one-way ANOVA followed by Bonferroni′s post hoc test (∗p < 0.05 vs Vector). (E) Protein levels of foam cell markers in PHLPP1 overexpressing or knockdown cells along with densitometric quantification (bottom). Data are a representative of three independent experiments unless specified. Numerical data are expressed as mean ± SEM [except mean ± SD for (E)-CHOP (n = 2)]. |
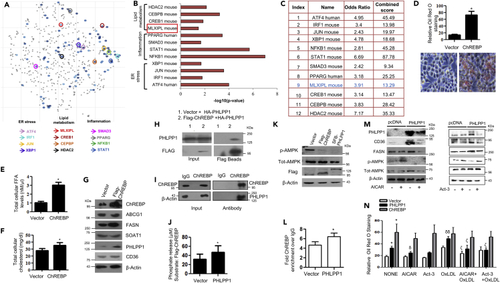
PHLPP1-dependent neutral lipid accumulation involves ChREBP and AMPK (A) Scatterplot of enriched transcription factors in set 3: Differentially altered gene-set from set 3 (cut-off: FC > 1.5, FDR 0.05) was analyzed by “Enrichr” tool to analyze the possible transcription factors involved in the gene alterations using ChIP-X enrichment analysis (ChEA) gene set library (The brighter the color, the more significant the transcription factor). (B and C) Plot and table indicating the –log10 p value (B) and terms odds ratio, and combined score (C) used by the Enrichr software to represent the output (scatterplot). p values are computed based on alterations in the number of genes that are known primary or secondary targets of transcription factors; Odds ratio indicates a measure of association between input and outcome; combined score: log(p) ∗z, p is p value, and z = deviation from the expected rank. (D) Neutral lipid staining by Oil Red O in ChREBP overexpressing cells along with quantification (top); Images are taken at |×20×| magnification. Each image is a representative image of four different experiments with a minimum of eight different fields in each experiment. Statistical analysis was performed using two-tailed t-test (∗p < 0.05, vs Vector). (E and F) Total cellular FFA (E) and cholesterol levels (F) upon ChREBP overexpression. Statistical analysis was performed using two-tailed t-test (∗p < 0.05, vs Vector). (G) Protein levels of foam cell markers in ChREBP overexpressing cells. Densitometric analysis is shown in Figure S5A. (H and I) Pull-down assay: HA-PHLPP1 and Flag-ChREBP interaction in HEK293T cells (H) and endogenous interaction (I) between PHLPP1 and ChREBP in RAW 264.7 cells; (J) Malachite green assay: phosphate release upon the incubation of Flag-ChREBP with SFB-PHLPP1 in vitro. Statistical analysis was performed using two-tailed t-test (∗p < 0.05, vs Vector). (K) AMPK Thr172 phosphorylation in ChREBP or PHLPP1 overexpressing RAW 264.7 cells. Densitometric analysis is shown in Figure S5B. (L) Graph showing enriched ChREBP binding to FASN promoter upon PHLPP1 overexpression in ChIP-qPCR. Statistical analysis was performed using two-tailed t-test (∗p < 0.05 vs vector). (M) Effect of AICAR and Act-3 on CD36 and FASN protein levels in PHLPP1 overexpressing cells. Densitometric analysis is shown in Figures S5C and S5D. (N) Oil Red O quantification of neutral lipids in PHLPP1 and ChREBP over-expressed RAW 264.7 cells treated with AICAR and Act3. Images from three different experiments with a minimum of eight different fields in each experiment were used to quantify the data. Statistical analysis was performed using one-way ANOVA followed by Bonferroni′s post hoc analysis (∗p < 0.05 versus vector-untreated; δp < 0.05, δδp < 0.01 versus corresponding control-untreated; ζp < 0.05 versus corresponding sample OxLDL-treated). Data are a representative of three independent experiments. Numerical data are expressed as mean ± SEM. See also Figures S4 and S5. |
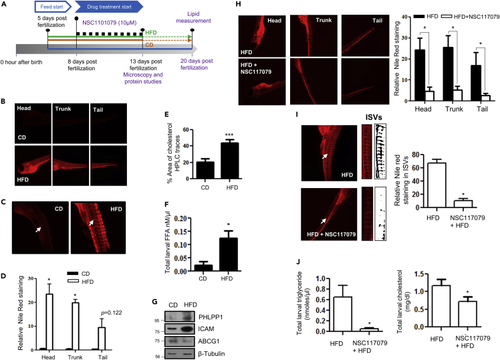
Pharmacological PHLPP1 inhibition attenuates lipid accumulation in HFD-fed zebrafish larvae (A) Zebrafish larval experiment design; (B–D) Fluorescent microscopic images of head, trunk, and tail (B) along with intersegmental blood vessels (ISVs) (C) with ImageJ quantification (D). Statistical analysis was performed using two-tailed t-test (∗p < 0.05 vs CD). (E and F) Estimation of cholesterol (HPLC-based; (E) and FFA (F) levels in CD vs HFD-fed zebrafish larvae; each experimental data point was from 10 pooled larvae. Statistical analysis was performed using two-tailed t-test (∗p < 0.05, ∗∗∗p < 0.001 vs CD). (G) Protein levels of indicated proteins in HFD fed zebrafish larvae. (H and I) Fluorescent microscopic images of head, trunk, and tail (H) along with intersegmental blood vessels (ISVs; I) with ImageJ quantification (Right). Statistical analysis was performed using two-tailed t-test (∗p < 0.05 vs HFD). (J) Kit-based estimations of whole-body triglyceride and cholesterol levels in NSC117079-treated zebrafish larvae. Each experimental data point was from 10 pooled larvae. Statistical analysis was performed using two-tailed t-test (∗p < 0.05 vs HFD). Each microscopic image in (B, C, H, and I) represents three to four experiments, each studying minimum five larvae; Magnification: Head, trunk, and tail - |×4×|; ISVs– 10X. Data are a representative of at least three independent experiments, unless specified. Numerical data are expressed as mean ± SEM. PHENOTYPE:
|
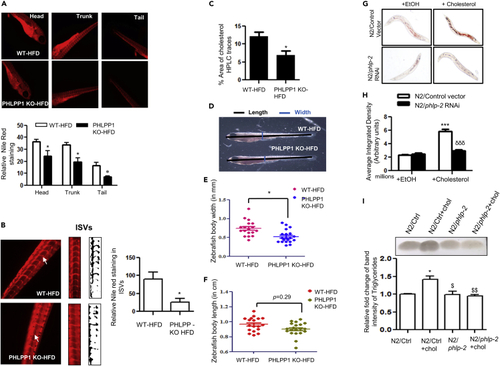
CRISPR-Cas9-mediated PHLPP1 knockout in HFD-fed zebrafish larvae and siRNA silencing of phlp-2 in C. elegans diminishes lipid accumulation (A and B) Fluorescent microscopic images of head, trunk, and tail (A) along with intersegmental blood vessels (ISVs; B) with quantification (A, Bottom panel and B, right panel). Each microscopic image represents three to four experiments with each experiment studying minimum of five larvae; Magnification: Head, trunk, and tail - |×4×|; Intersegmental blood vessels – 10X; Statistical analysis was performed using two-tailed t-test (∗p < 0.05 vs WT-HFD). (C) Cholesterol levels in PHLPP1-knockout HFD-fed zebrafish larvae measured by HPLC-based method. Each experimental data point indicates 20 pooled larvae; Statistical analysis was performed using two-tailed t-test (∗p < 0.05 vs WT-HFD). (D–F) Pictorial depiction along with linear body width (E) and whole-body length (F) measurement in PHLPP1-knockout zebrafish larvae; Statistical analysis was performed using two-tailed t-test (∗p < 0.05 vs WT-HFD). (G and H) Microscopic images (G) and quantification (H) of Oil Red O staining in cholesterol-fed phlp-2 knockdown C. elegans; data presented are from a representative experiment of two independent trials (n = 7–12 per trial); Statistical analysis was performed using one-way ANOVA followed by Bonferroni′s post hoc analysis (∗∗∗p < 0.001 vs N2/control+EtOH; δδδp < 0.001 vs N2/control+cholesterol). (I) TLC analysis of triglyceride levels in cholesterol-fed phlp-2 knockdown C. elegans along with ImageJ quantification (Bottom). Statistical analysis was performed using one-way ANOVA followed by Bonferroni′s post hoc analysis (∗p < 0.05 vs N2/Ctrl; $p < 0.05, $$p < 0.01 vs N2/Ctrl+chol). Data are a representative of at least three independent experiments, unless specified. Numerical data are expressed as mean ± SEM. See also Figure S6. PHENOTYPE:
|
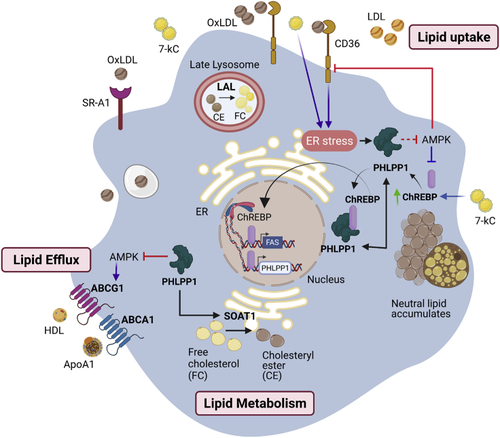
Graphical abstract of PHLPP1-mediated foam cell formation PHLPP1 protein levels are elevated in OxLDL and ER stress-exposed macrophages and HFD-fed zebrafish larvae. PHLPP1 augmented cellular cholesterol and FFAs levels through the regulation of key lipogenic genes such as FASN, CD36, and so forth. Transcriptomic analysis revealed that loss of PHLPP1 suppresses gene expression associated with fatty acid synthesis and cholesterol metabolism. PHLPP1 promoted OxLDL-uptake in AMPK/CD36-dependent manner. Also, 7-kC treatment mediates the augmentation of ChREBP levels. Furthermore, PHLPP1 interacted with and dephosphorylated lipogenic transcription factor ChREBP and enhanced the levels of its target, FASN. Data from other studies suggest that AMPK assists in lipid efflux via upregulating ABCG1 levels. Thus, PHLPP1 mediates foam cell formation via ChREBP/AMPK axis (Green arrow indicates protein increase; purple arrow indicates data from other studies). |