
Fig. 3
- ID
- ZDB-IMAGE-230224-3
- Publication
- Balamurugan et al., 2022 - PHLPP1 promotes neutral lipid accumulation through AMPK/ChREBP-dependent lipid uptake and fatty acid synthesis pathways
- All Figures
- Figures for Balamurugan et al., 2022
|
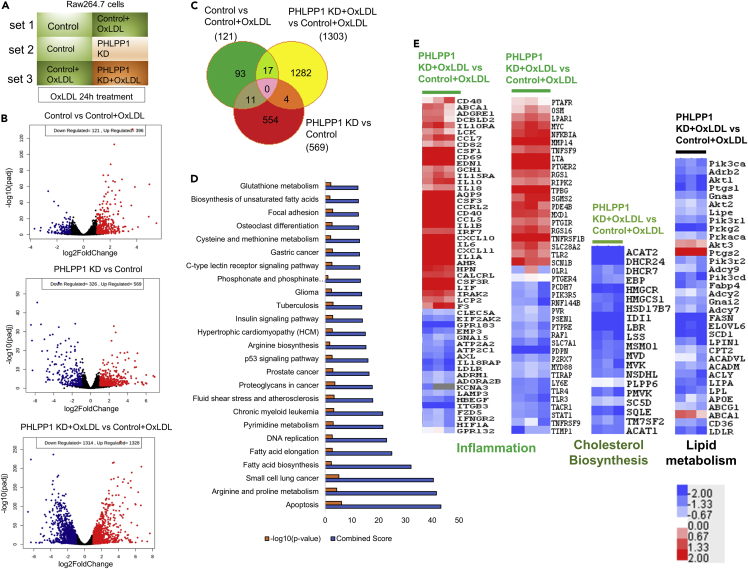
Fig. 3
RNA-seq analysis of PHLPP1 depleted in vitro foam cells
(A) Representation of experimental conditions-set 1: control cells versus OxLDL-treated control cells; set 2: control cells versus PHLPP1-knockdown cells; set 3: OxLDL-treated control cells versus OxLDL-treated PHLPP1-knockdown cells.
(B) Volcano plot analysis of set 1, 2 and 3 genes.
(C) Venn diagram showing commonly affected genes in the three sets.
(D) Top 25 affected pathways in set 3 were identified using Enrichr tool by submitting the differentially altered genes from set 3 (fold change >1.5, FDR: 0.05). KEGG 2021 human pathways library was used to analyze the possible disease conditions.
(E) Heatmap analysis of selected pathways (inflammation, cholesterol biosynthesis, and lipid metabolism) of set 3. Data are a representative of three independent experiments. See also Figure S3.