
Fig. 6
- ID
- ZDB-IMAGE-230224-6
- Publication
- Balamurugan et al., 2022 - PHLPP1 promotes neutral lipid accumulation through AMPK/ChREBP-dependent lipid uptake and fatty acid synthesis pathways
- All Figures
- Figures for Balamurugan et al., 2022
|
Fig. 6
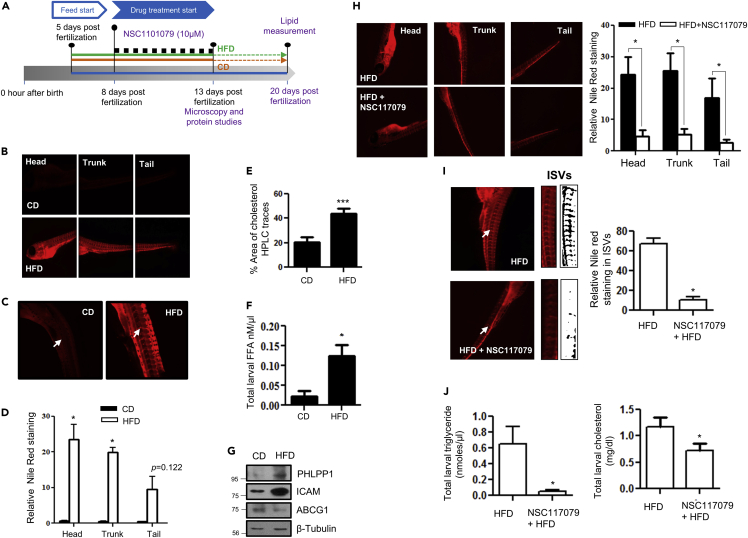
Pharmacological PHLPP1 inhibition attenuates lipid accumulation in HFD-fed zebrafish larvae
(A) Zebrafish larval experiment design;
(B–D) Fluorescent microscopic images of head, trunk, and tail (B) along with intersegmental blood vessels (ISVs) (C) with ImageJ quantification (D). Statistical analysis was performed using two-tailed t-test (∗p < 0.05 vs CD).
(E and F) Estimation of cholesterol (HPLC-based; (E) and FFA (F) levels in CD vs HFD-fed zebrafish larvae; each experimental data point was from 10 pooled larvae. Statistical analysis was performed using two-tailed t-test (∗p < 0.05, ∗∗∗p < 0.001 vs CD).
(G) Protein levels of indicated proteins in HFD fed zebrafish larvae.
(H and I) Fluorescent microscopic images of head, trunk, and tail (H) along with intersegmental blood vessels (ISVs; I) with ImageJ quantification (Right). Statistical analysis was performed using two-tailed t-test (∗p < 0.05 vs HFD).
(J) Kit-based estimations of whole-body triglyceride and cholesterol levels in NSC117079-treated zebrafish larvae. Each experimental data point was from 10 pooled larvae. Statistical analysis was performed using two-tailed t-test (∗p < 0.05 vs HFD). Each microscopic image in (B, C, H, and I) represents three to four experiments, each studying minimum five larvae; Magnification: Head, trunk, and tail - |×4×|; ISVs– 10X. Data are a representative of at least three independent experiments, unless specified. Numerical data are expressed as mean ± SEM.